Who lives in rural America? The geography of rural race and ethnicity
In our first story in the Rural Aperture Project, a multi-story series funded by the Robert Wood Johnson Foundation’s Thrive Rural initiative, we delved deep into understanding what it means to be considered rural in the United States. And in Part 1 of our second story on racial and ethnic diversity in rural America, we tackled the underlying theoretical and policy implications for why it is so important to have a clear vision of who actually lives in rural America, demographically speaking.
![]() But how are different racial and ethnic groups distributed across rural America? And what are the historical factors that have influenced the current geography? In Part 2 of our story on rural race and ethnicity, we take a rural lens to all five of the census’ racial and ethnic categories — “Black,” “Hispanic or Latino,” “American Indian and Alaska Native,” “Native Hawaiian and Pacific Islander,” “Asian” and “white.” To learn more about how data can lead to misconceptions about rural America, be sure to read Part 1.
But how are different racial and ethnic groups distributed across rural America? And what are the historical factors that have influenced the current geography? In Part 2 of our story on rural race and ethnicity, we take a rural lens to all five of the census’ racial and ethnic categories — “Black,” “Hispanic or Latino,” “American Indian and Alaska Native,” “Native Hawaiian and Pacific Islander,” “Asian” and “white.” To learn more about how data can lead to misconceptions about rural America, be sure to read Part 1.
Each section is structured around a set of five questions:
- What is the current rural population of this racial or ethnic group?
- How does the U.S. Census Bureau define different racial and ethnic groups?
- What factors have shaped rural demographics today?
- What information can be gained by going beyond the top-line census numbers?
- What are the growth trends of this rural group?
Having a clear picture of rural demographics matters because demographic data has a strong impact on how racial equity programs and policies are designed and implemented. As framed in a 2020 analysis on rural development, rethinking rural development policy will “require investing in these communities from the bottom up instead of the top down, empowering them to leverage their existing assets and knowledge to promote homegrown economic opportunities.”
Recent top-down federal investments — such as those identified as a part of the Infrastructure Investment and Jobs Act, the CHIPS Act, and the Inflation Reduction Act — are mandated to prioritize advancing racial equity in the design of these programs and the distribution of resources. But there is limited guidance on how to best do so in rural areas. Having a strong foundation of tools for rural demographic analysis, and an understanding of what different types of rural communities look like based on this analysis, is an important first step in the process of expanding rural economic opportunities to all who live there.
For this piece, we strived to leverage partnerships and conversations with a diverse array of rural organizations from across the country to inform our work and analysis. While it is impossible to provide a complete and wholly representative depiction of current and historical rural demographics, the historical framing included is intended to provide background so as to better understand why data may look the way it does.
This piece is designed to serve as a guide to data on rural demographics. While this piece will primarily focus on the geographic distribution of various racial and ethnic groups, future Rural Aperture Project stories will explore implications on racial equity. The insights gained by considering race and ethnicity in rural places can help create a more accurate picture of rural America that informs efforts to advance racial equity in rural communities.
You can explore the data and history of each racial and ethnic group by clicking through the table of contents available below, and at the end of each section.
Acknowledgements
This project would not have been possible without the valuable insight, critique, and feedback from our collaborators who are embedded within a diverse array of communities, organizations, and institutions across the country, and helped to ground-truth our narrative framing and data. Thank you to AAPI Data, Center for Sustainable Development at the Brookings Institution, MDC, Oweesta, Partners for Rural Transformation, and Rural Community Assistance Corporation for their wisdom and support.
Table of contents
• The Black population in rural America
• The Hispanic and Latino population in rural America
• The Native population in rural America
• The Asian population in rural America
• The white population in rural America
![]()
Definitions and notes on the U.S. census
The majority of the data we are using in this analysis is from the U.S. Census Bureau’s decennial census and the American Community Survey (ACS). The first census took place in 1790, and the first ACS was in 2005. In the first census, the only racial categories were “Slaves,” “Free white females and males,” and “All other free persons.” The census has come a long way since its inception and made significant adjustments to reflect the social contexts of American society.
However, a major challenge of the census is that it pushes individuals to identify themselves into specific boxes — which they may or may not fully identify with, as only half of Americans think the census reflects their identity very well. Yet the census is still the broadest and most accurate survey of demographic information that exists in the U.S., and it is important to recognize that the categories are continually evolving.
In the U.S. census, there are five overarching racial categories: “White,” “Black or African American,” “American Indian or Alaska Native,” “Asian,” and “Native Hawaiian or Other Pacific Islander.” A sixth racial category includes “Some other race.” As of 2000, respondents are able to select more than one race. (*Note: Based on consultations with Native organizations, we use the term “Native American” to refer to those who identified as “American Indian” in the census.)
The census then layers overtop an “ethnicity” category as “Hispanic or Latino” or “Not Hispanic or Latino” — for example, someone could be White and non-Hispanic, or Black and Hispanic. Unless otherwise noted, the data refers to people who selected one race alone. Except where otherwise noted, we use terms consistent with census categories to describe populations, although we recognize that these terms are not fully representative of the language people use to describe their racial or ethnic identity. Broader context on the definitions of each racial and ethnic census category, and how we are defining them in this analysis, are included in the sections below.
Analyzing census data
We strived to accurately portray data around multiracial populations. Debates around the “right” way to analyze this data have persisted for decades, and it is an incredibly complicated, nuanced, and debated subject. Where possible and appropriate, we present data based on the total number of people who select a particular racial or ethnic group, which includes both the “alone” and “alone or in combination with other races” groupings within census data. Based on basic math, one would assume that all percentages of populations, when compared, should add up to 100%. But when it comes to population data, this is not always the case — and here are a few guiding principles to help understand why:
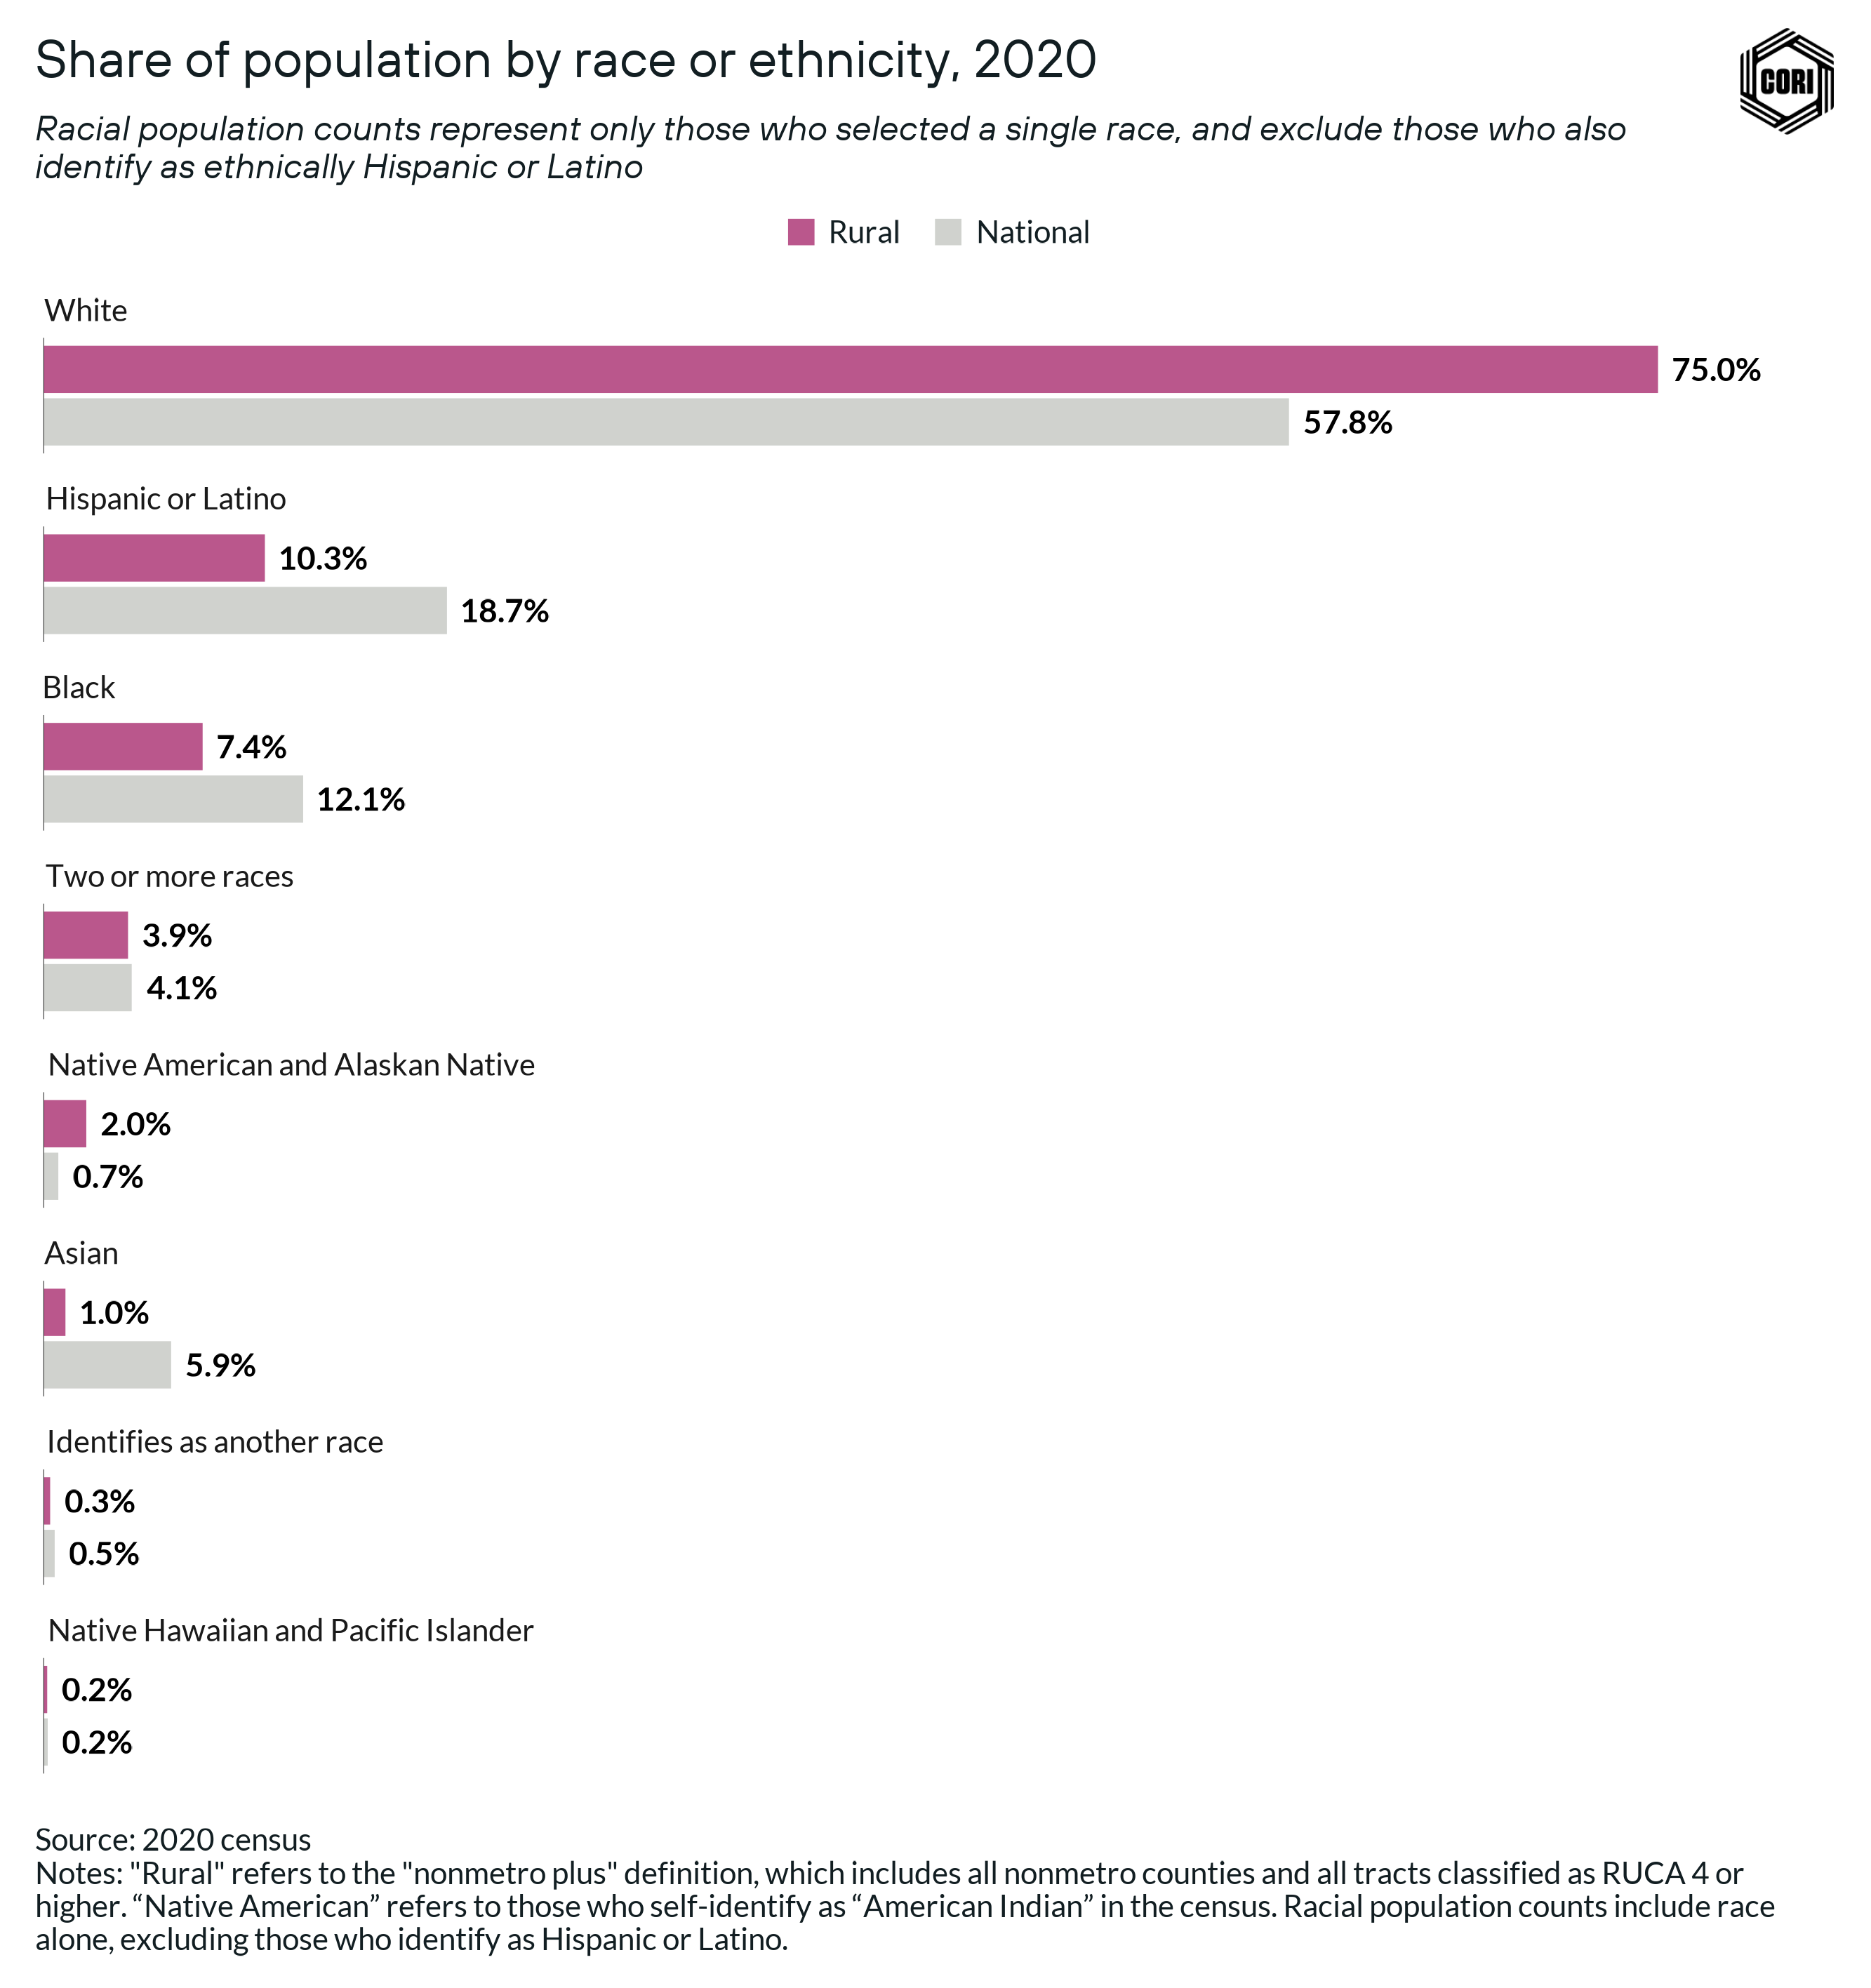
- If we are comparing racial percentages to represent part of a whole population, we use census data that represents “race alone, not Hispanic or Latino.” This is because when representing an entire population, we need to ensure that the categories are mutually exclusive. This is the case in Figure 1 from Part 1, for example, where we show that those who identify as white alone account for 75% of rural America.
- When we want to ensure broader representation of anyone who identifies as a particular race, we use census data that represents “race alone or in combination with another race.” This enables us to paint a more inclusive picture of individuals’ racial identities on a population level. When compared, these percentages may not add up to 100% because they are not intended to represent one singular picture of a population, and can lead to people being double counted across different races. This is the case of many visualizations in Part 2, where, for example, we show that over 84% of rural people identify as white, including those who are white and multiracial.
In sum, we want to underscore that any time we use the “alone or in combination” data, this includes people who identify as Hispanic or Latino. When we use just the “alone” category, it tends to be when we are comparing across racial and ethnic groups to avoid double counting, and in this case, the “alone” category does not include Hispanic or Latino unless otherwise noted. This approach aims at capturing the full picture of a given population, including those who have multiracial identities.
Following best practices for using demographic data to advance racial equity, we further disaggregate data on racial and ethnic groups to subgroups reported in the census to bring attention to important differences within groups. When possible, we prioritize using data from the 2020 census, but given that some of this data is not yet published, in some cases we use 2020 American Community Survey (ACS) data. We strive to provide transparency into our sources, and cite the year, data source, and rural definition for all stats (e.g. 2020 ACS-nonmetro, or 2020 census-nonmetro plus).
![]()
The Black population in rural America
Summary of data takeaways:
- In 2019, there were an estimated 4.8 million rural Americans that identified as Black, representing 8.6% of the total rural population.
- Over 80% of the rural Black population lives in the South.
- Over 75% of the rural Black population today lives in counties where Black populations have lived historically.
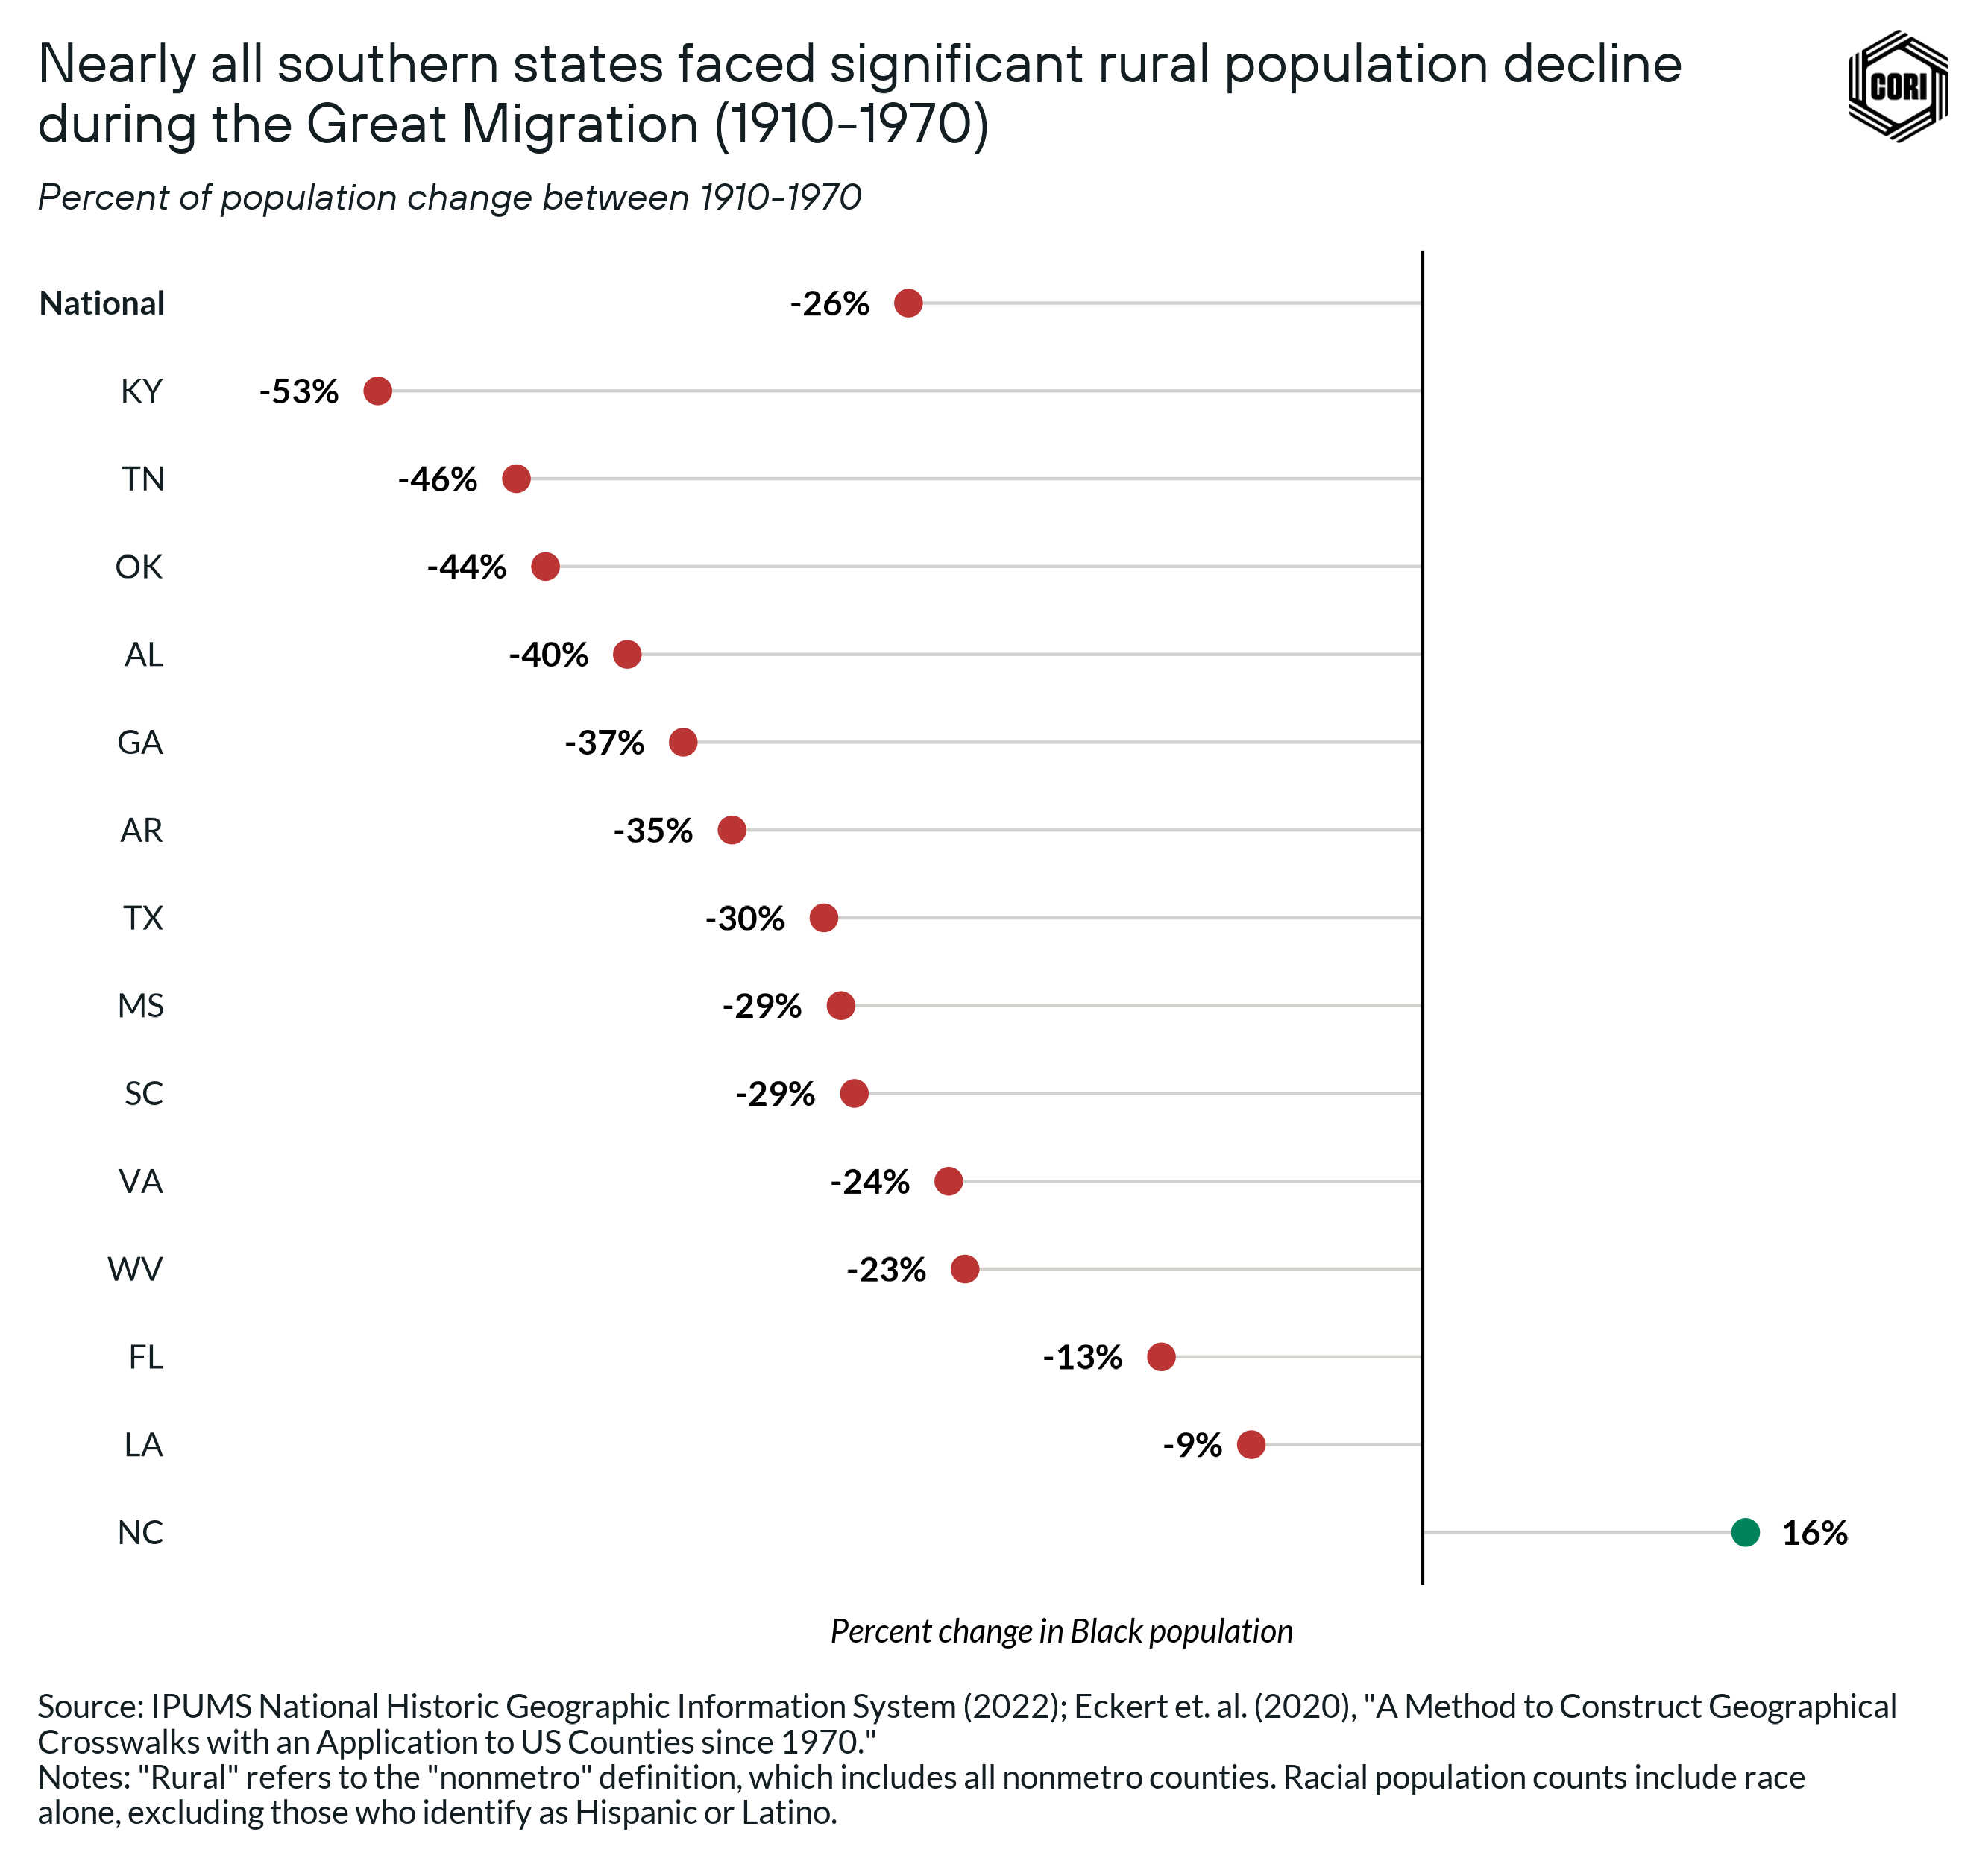
- During the Great Migration, the rural Black population declined by 26% — today’s rural areas of Georgia, Alabama, Arkansas lost more than a third of their Black populations, while losses were even greater in states like Kentucky, Tennessee, and Oklahoma.
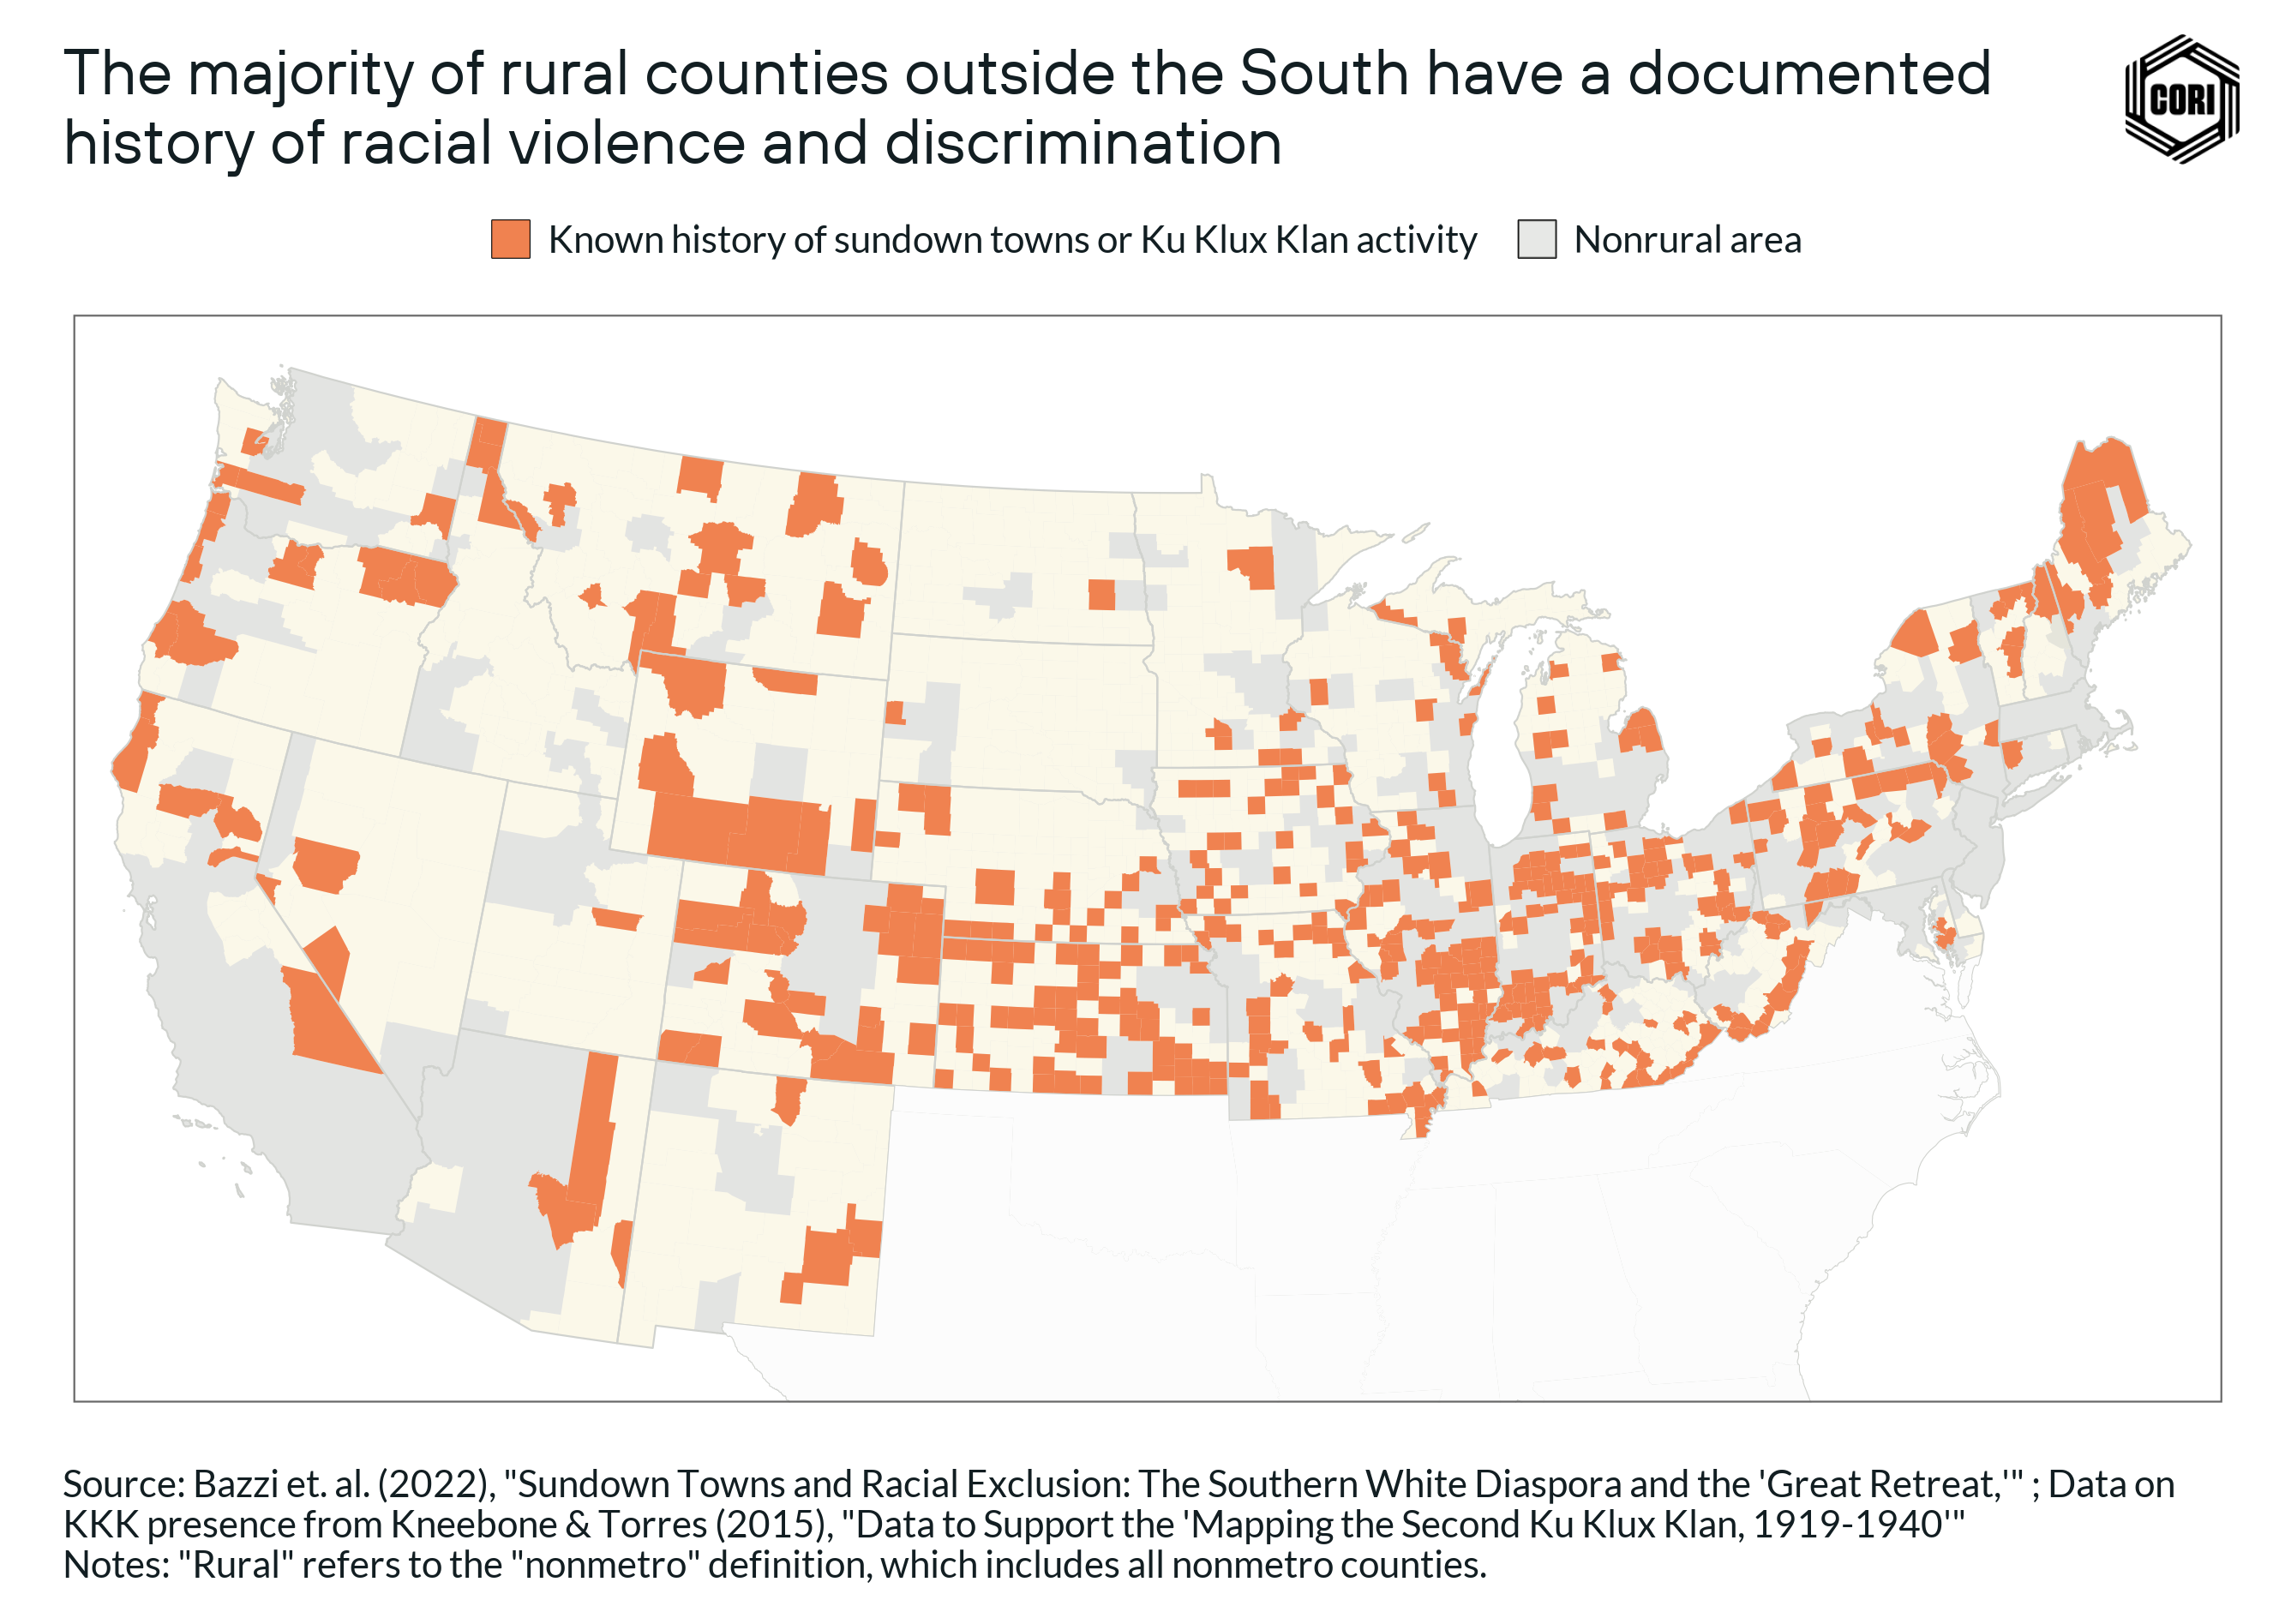
- Of the more than 1,200 rural counties outside of the South, 65% of them have a known history of sundown town policies or Ku Klux Klan activity.
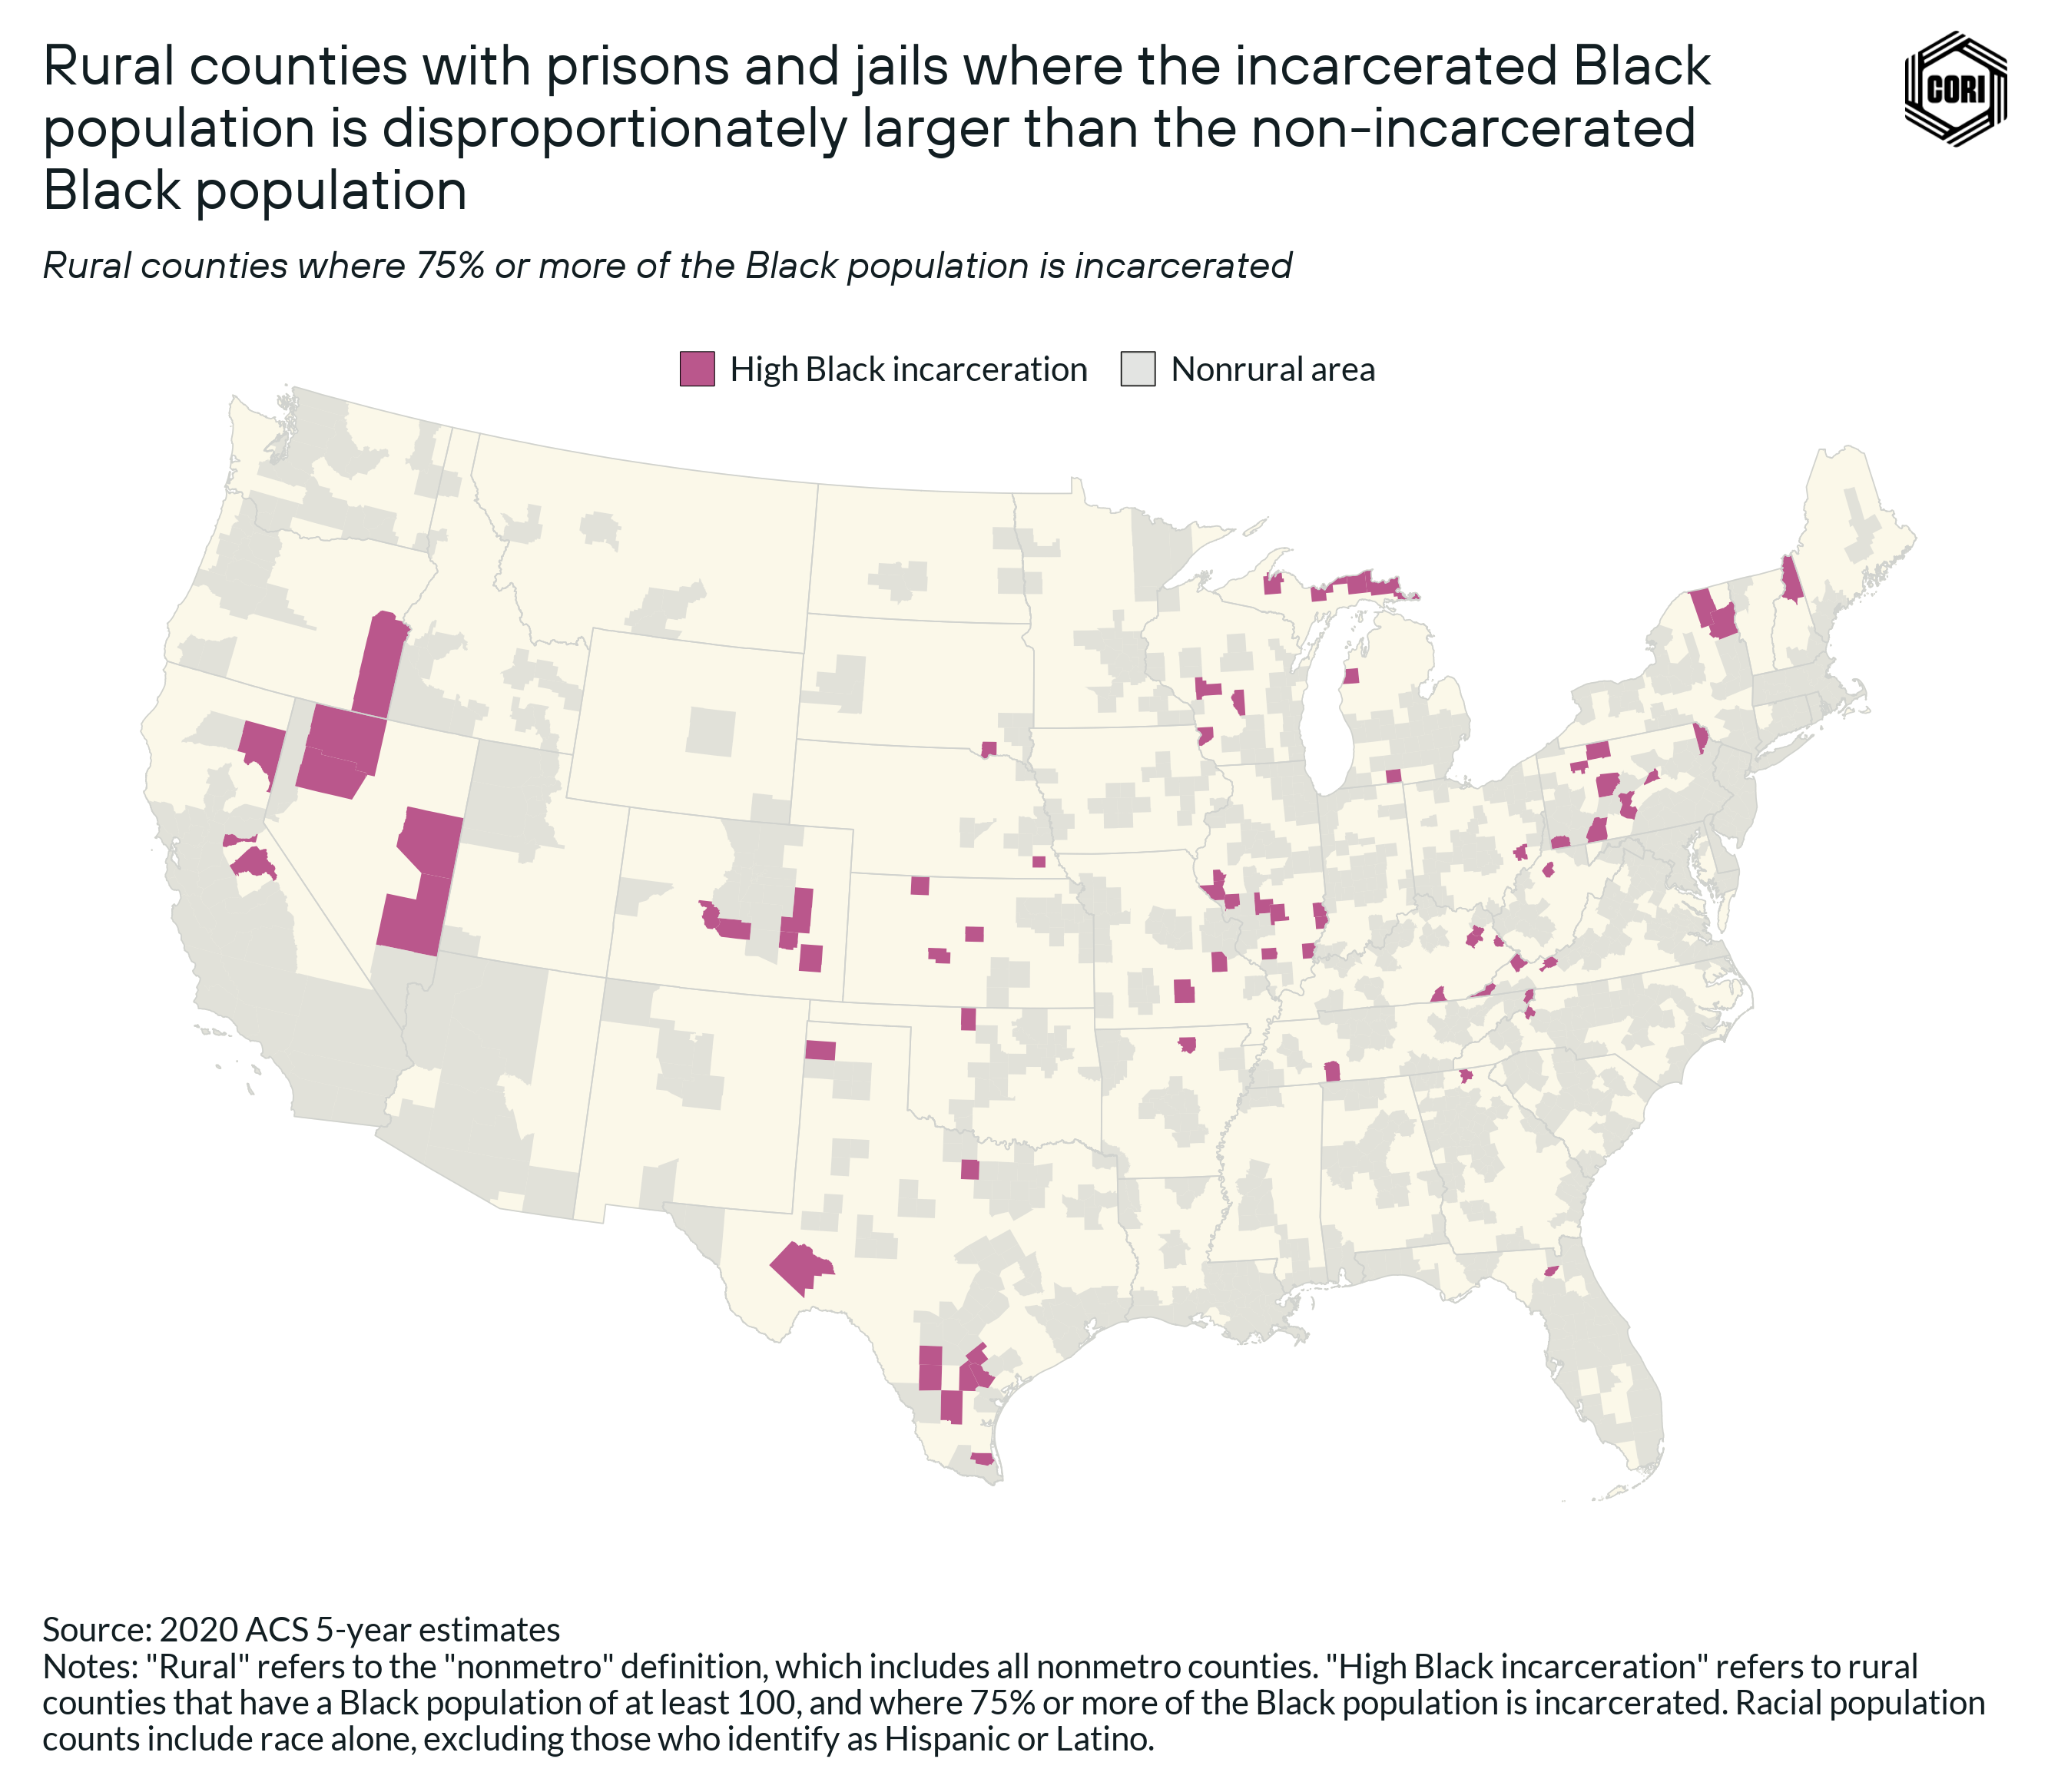
- Incarcerated people in rural long-term correction facilities accounted for 7% of the overall rural Black population in 2020. In comparison, in metro areas, the Black incarcerated population accounted for 1% of the overall urban Black population.
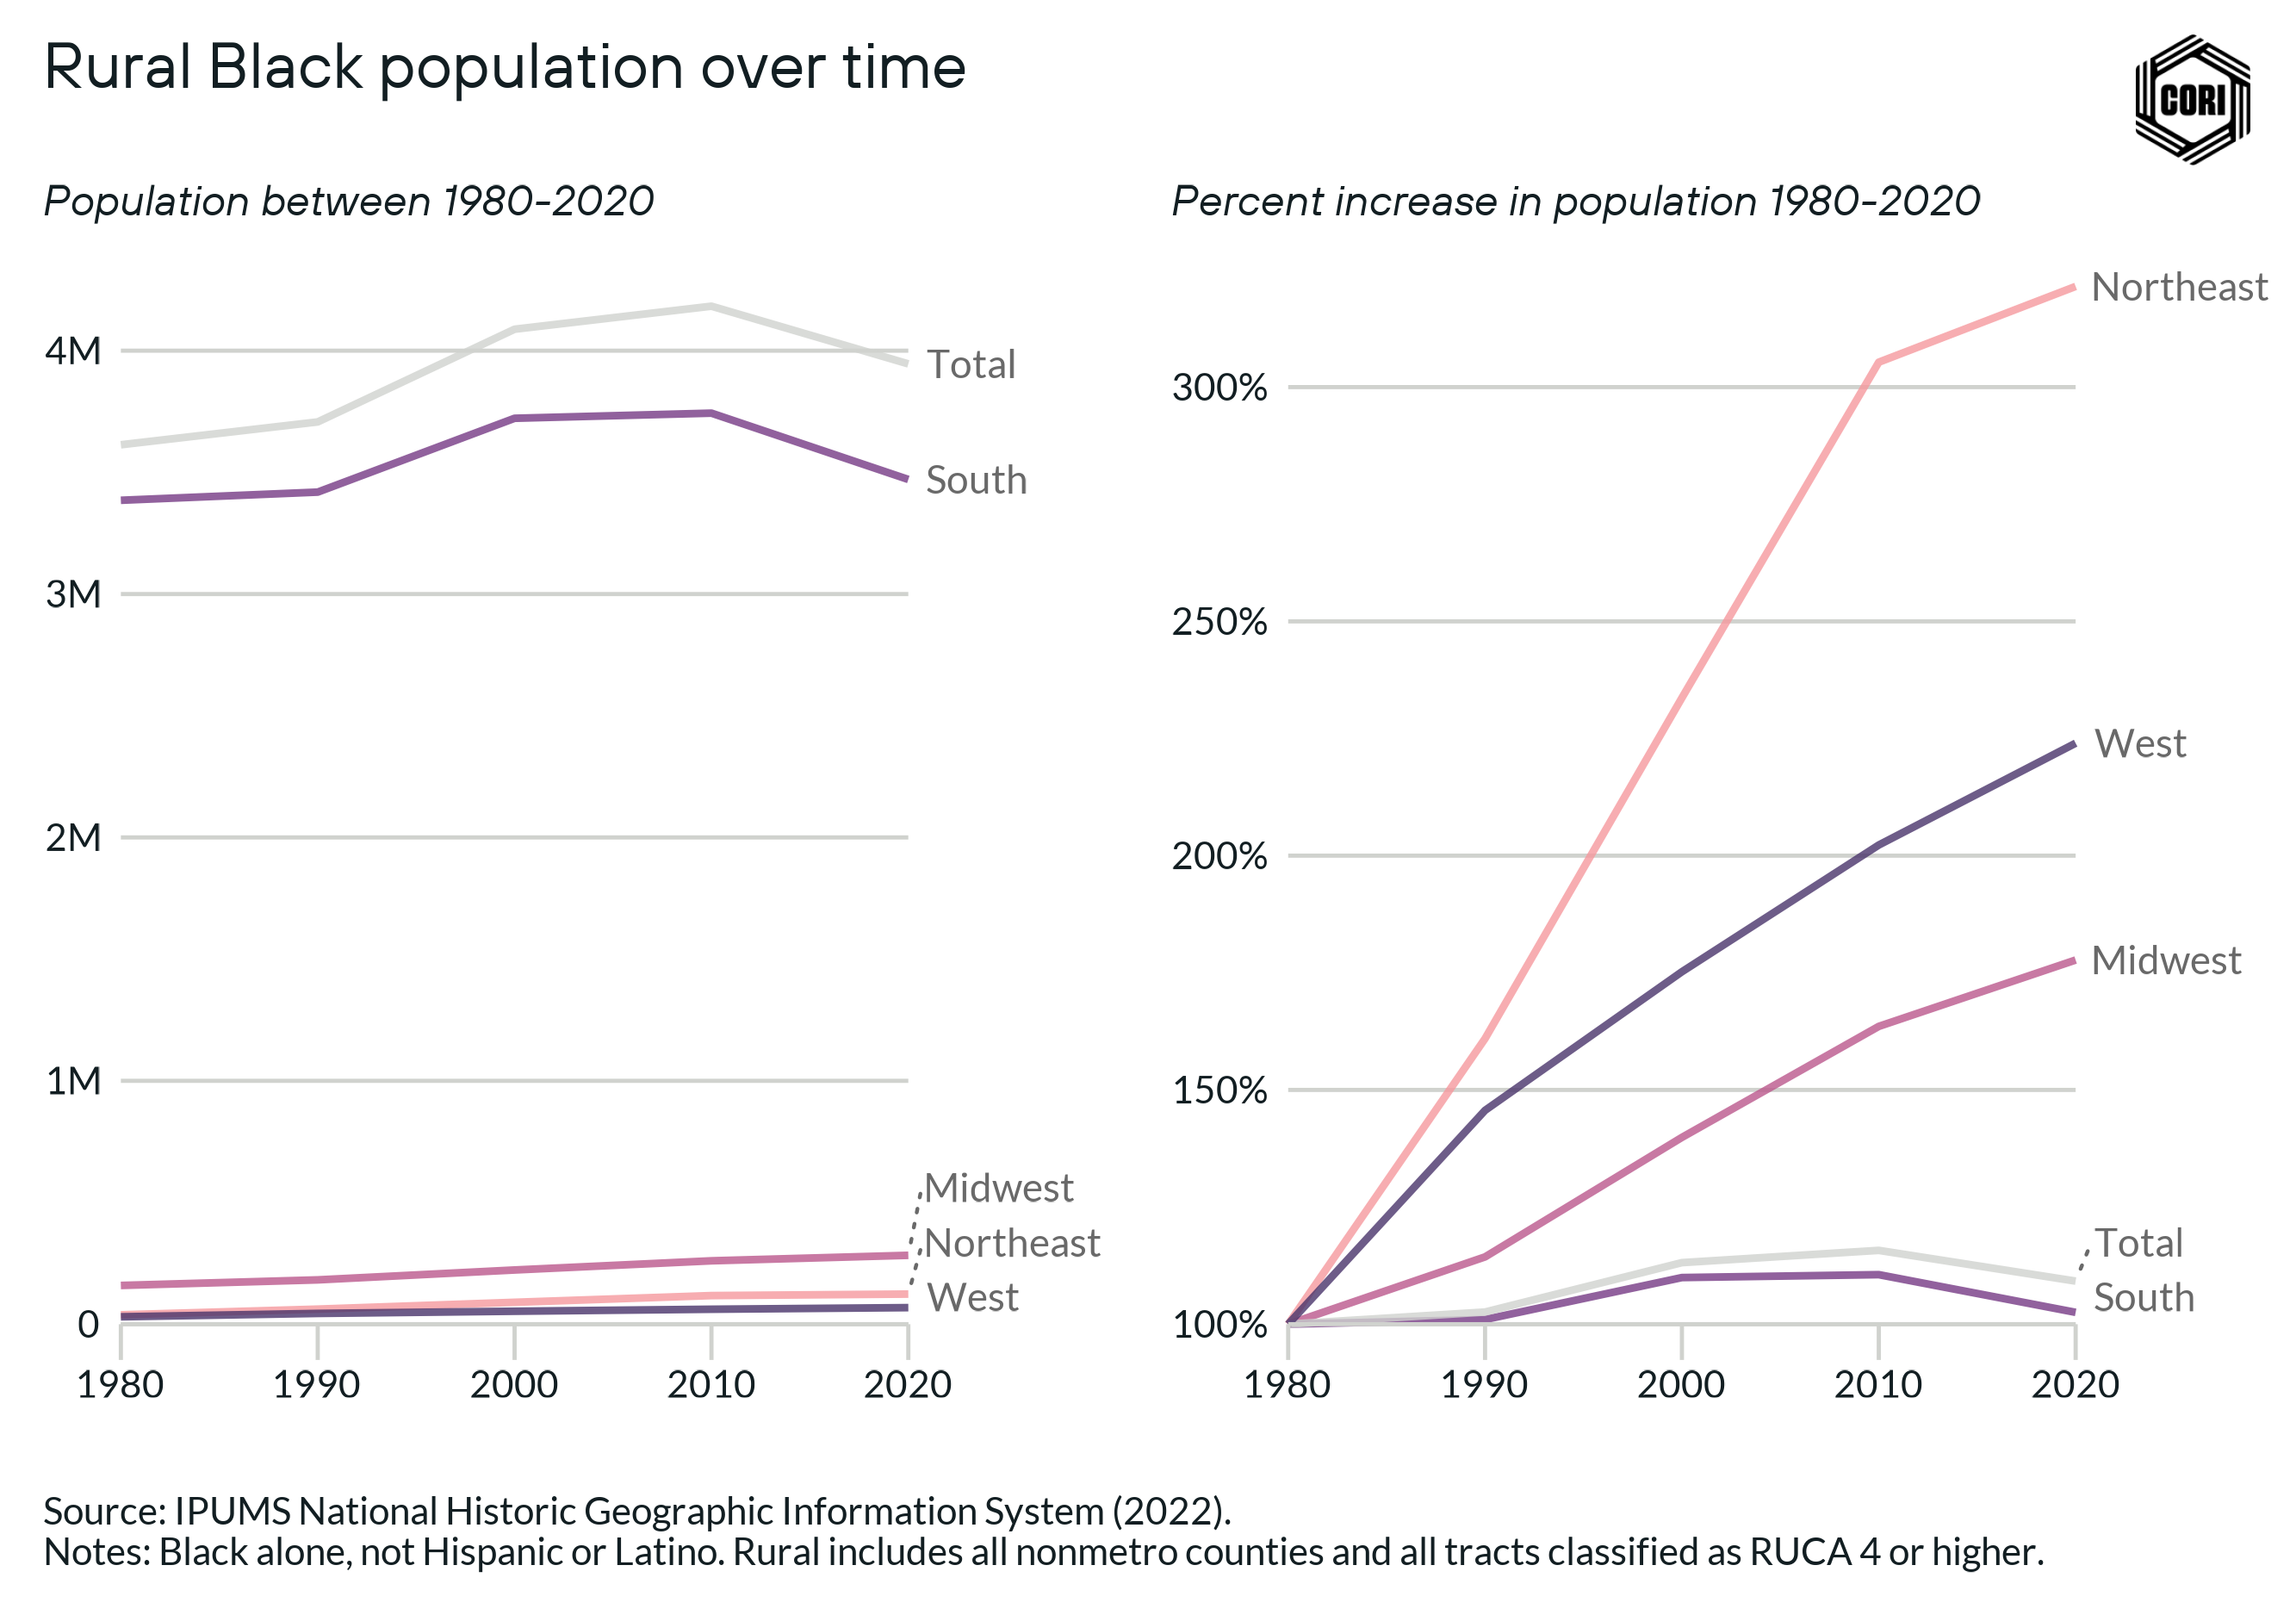
- After a period of growing rural Black populations from 1980 to 2010, the rural Black (alone) population declined again over the past decade.
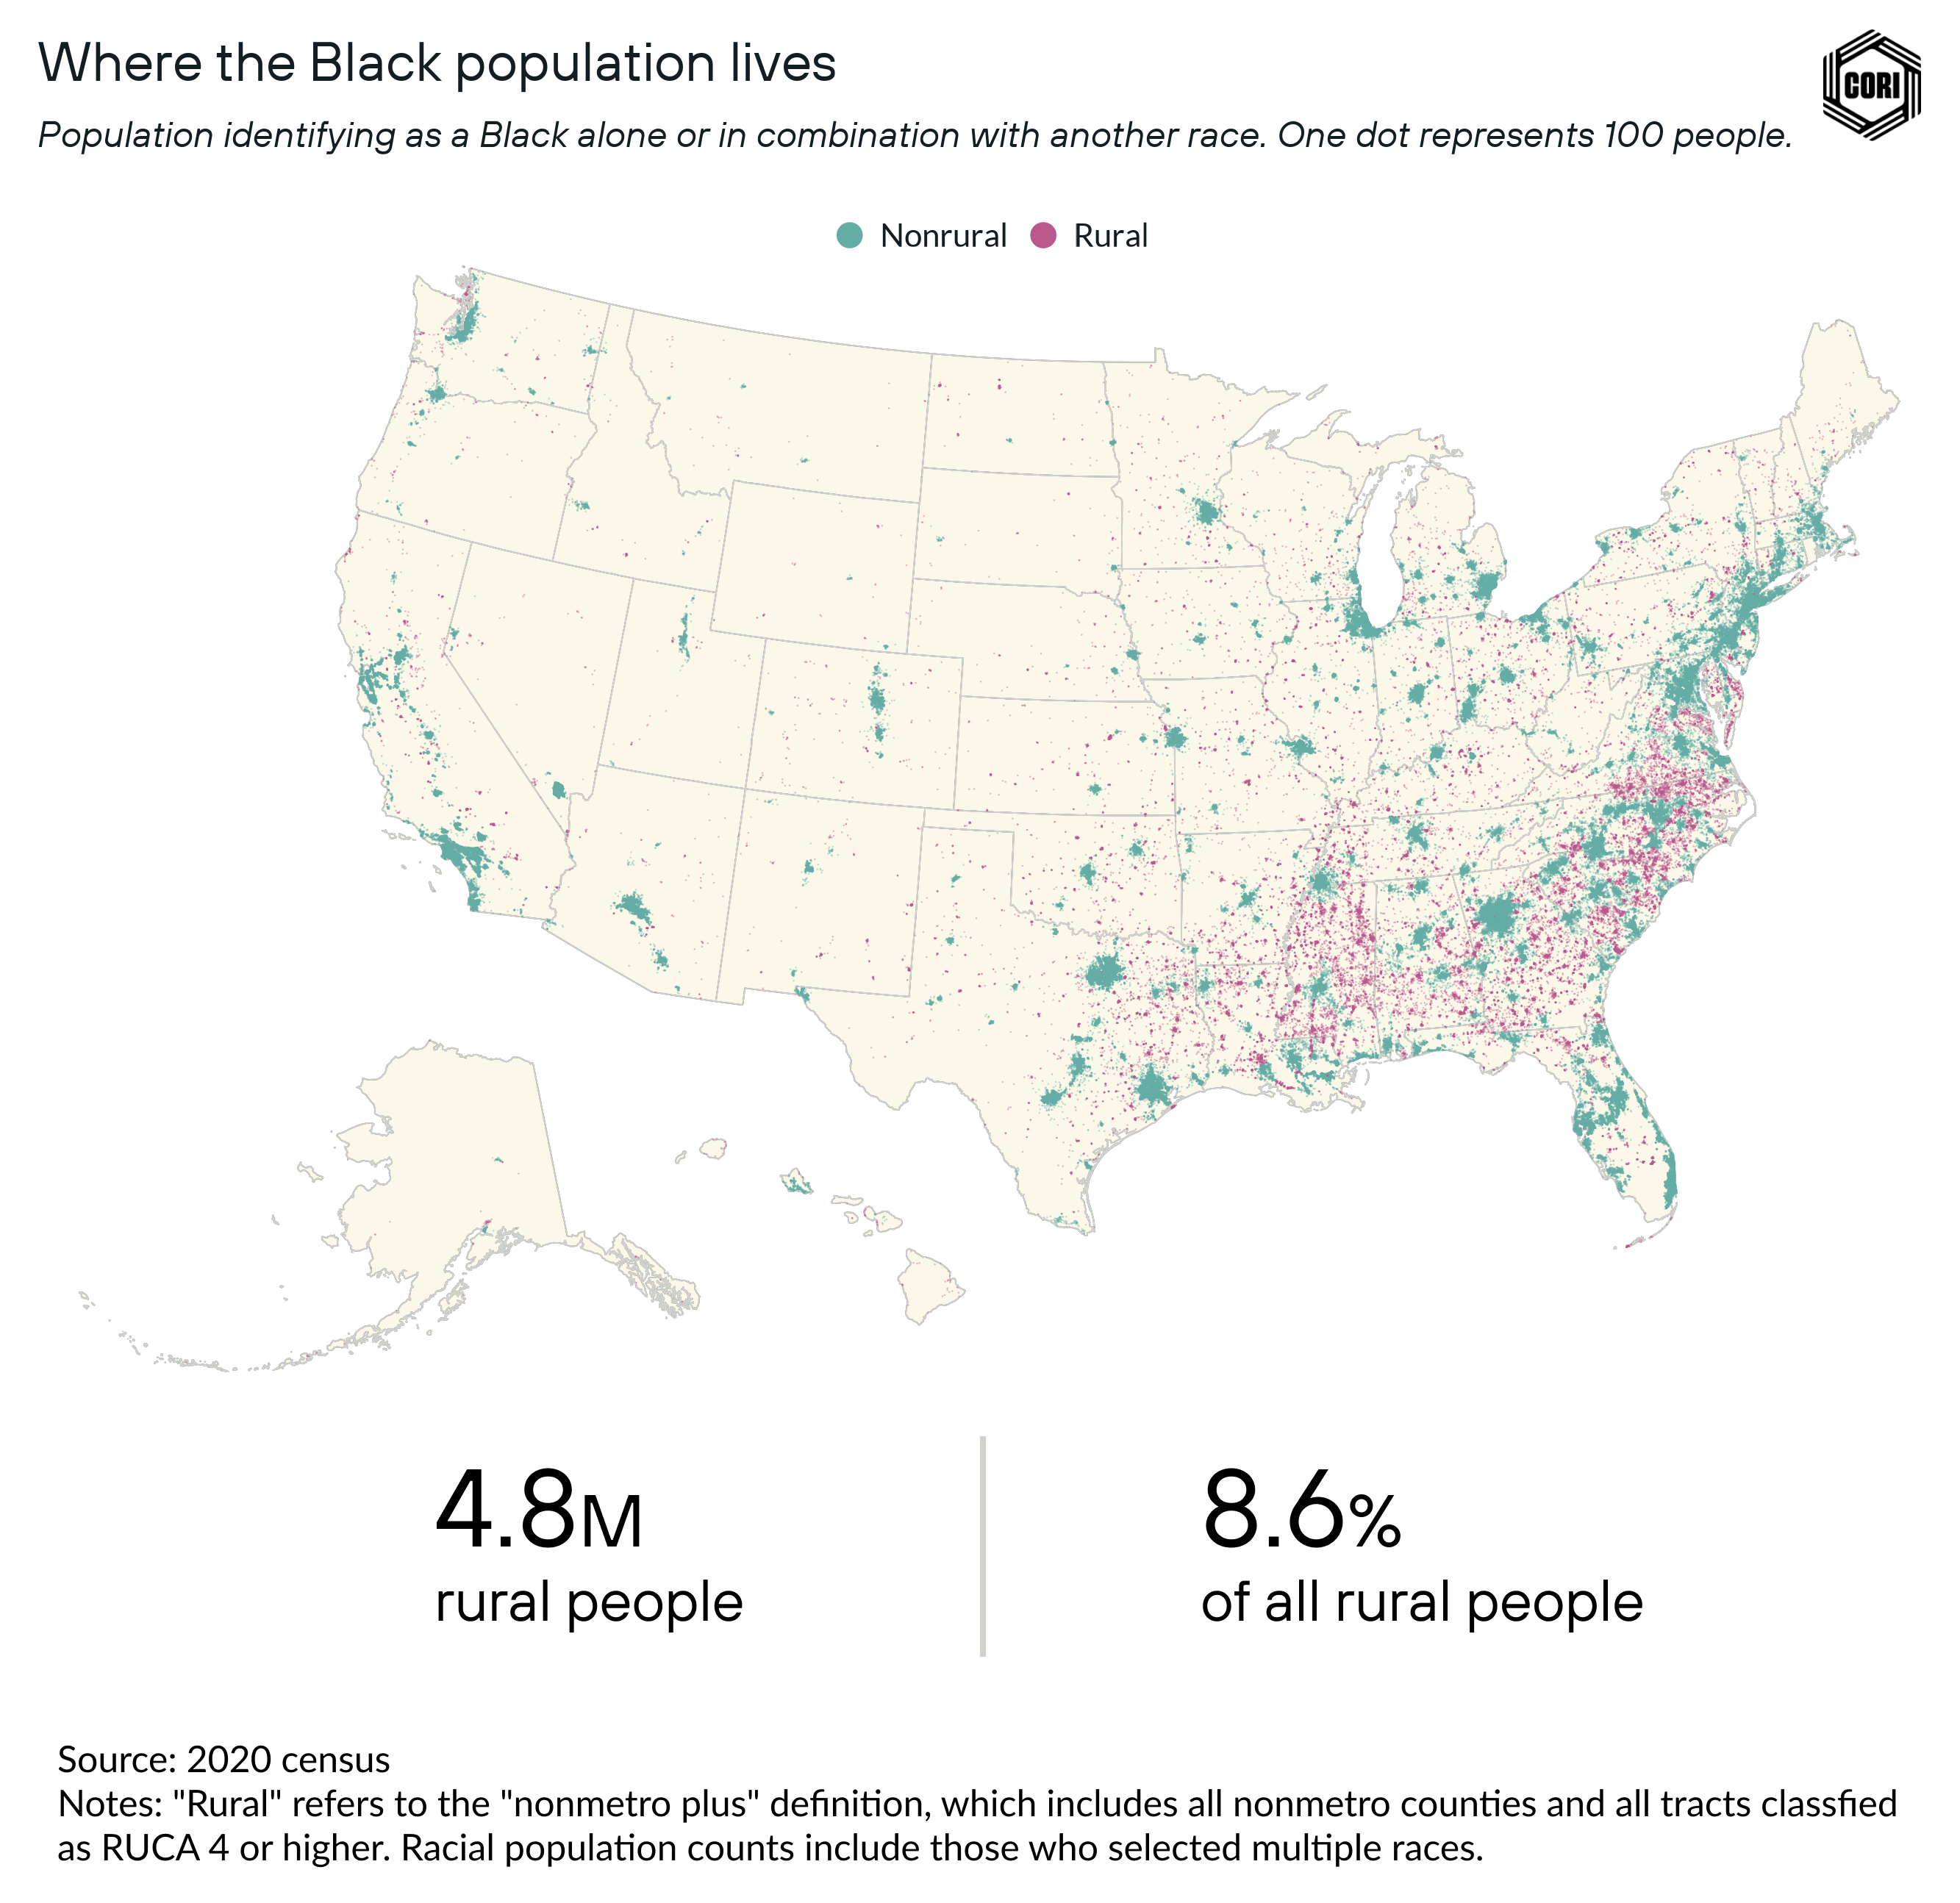
In 2019, there were an estimated 4.8 million rural Americans that identified as Black, representing 8.6% of the total rural population (above). Across all demographic groups in rural America, the Black population of the South is the most concentrated: Over 80% of the rural Black population lives in the region (2020 census-nonmetro plus).
Having clarity on the dynamics of this demography matters, as policies and programs intended to support the rural Black population need to take into account the fact that the needs, context, and community resources of the rural Black population in one part of the country may be vastly different than in another part of the country.
How the U.S. census defines “Black”
Today’s official census category of “Black, African American, or Negro” is defined as as “A person having origins in any of the Black racial groups of Africa.” This group includes Black individuals who are foreign-born, which comprise about 2% of the rural Black population. In our analysis, we use the term “Black” when we are referring to those who identify as Black and not Hispanic or Latino, unless otherwise noted.
The current framing of categorization has gone through a number of iterations, including “Negro or Black,” “Negro,” “Black, Mulatto, Quadroon, or Octoon,” “Slaves; Free colored person,” and “slave.” It is important to note that historic data provides grounding context, but by nature, historical data is incomplete and not fully representative of all individual experiences — particularly of people who were, or were not recognized as full citizens.
Factors that have shaped the rural Black population today
Throughout much of American history, as historians Cook, Logan and Parman describe, “the Black population was very much a rural population.” One of the preeminent factors in why this is stems from the long and brutal history of slavery that lasted through 1865 and the oppressive systems like sharecropping that persisted beyond the mid-1800s.
In 1860, there were 4 million enslaved persons in the U.S. — a group of people who were responsible for generating significant wealth in the South and for the country as a whole (NHGIS). Rural products like cotton were the cash crops that drove the entire U.S. economy and led to the concentration of the Black population in the rural South. Far after the end of slavery, segregationist policies — such as school segregation, redlining, and discriminatory lending — continued to limit social and economic opportunities in both rural and urban places for the Black population across the country, throughout the Jim Crow era and beyond.
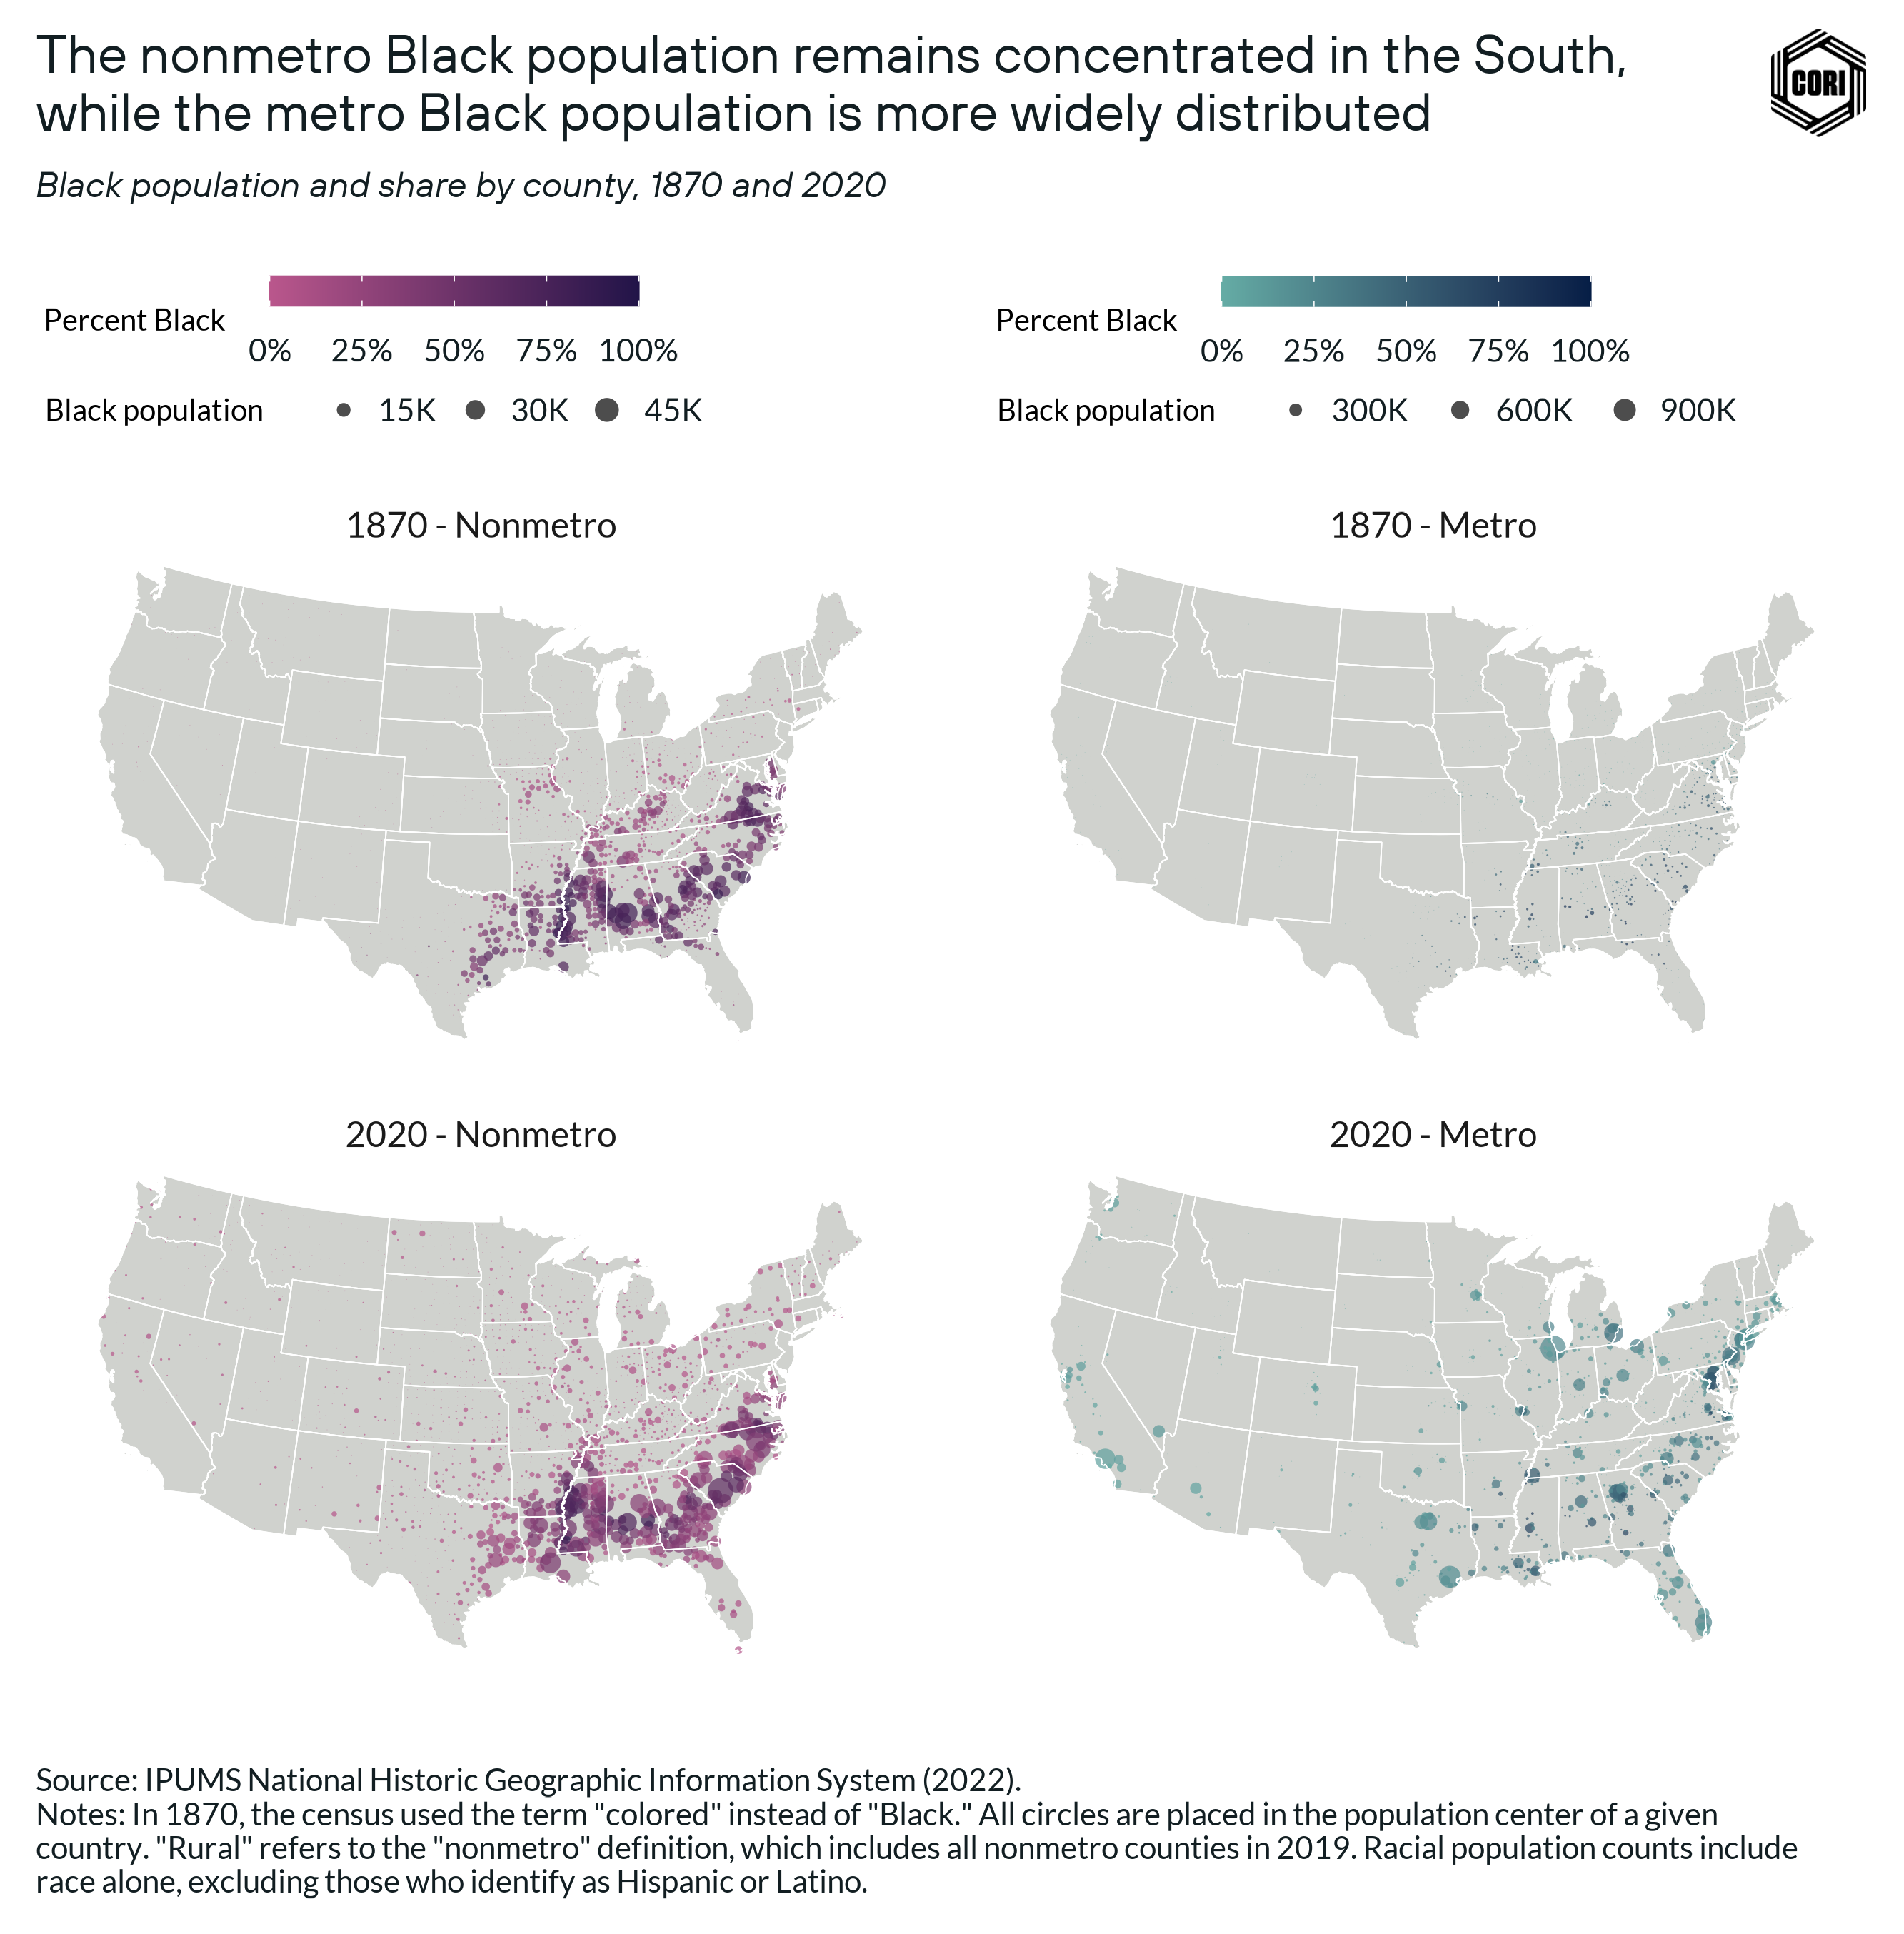
Today, over 75% of the rural Black population lives in counties where Black populations have lived historically (below). To the contrary, the Black population in metropolitan areas has become far more distributed.
But why is this the case?
Focusing only on the historic similarities of where rural Black populations live masks the fact that rural Black communities experienced major shifts during the 20th century. During the Great Migration, the era between 1915 and 1970, more than 6 million Black southerners left the rural South for cities in the northern and western areas of the U.S. (below).
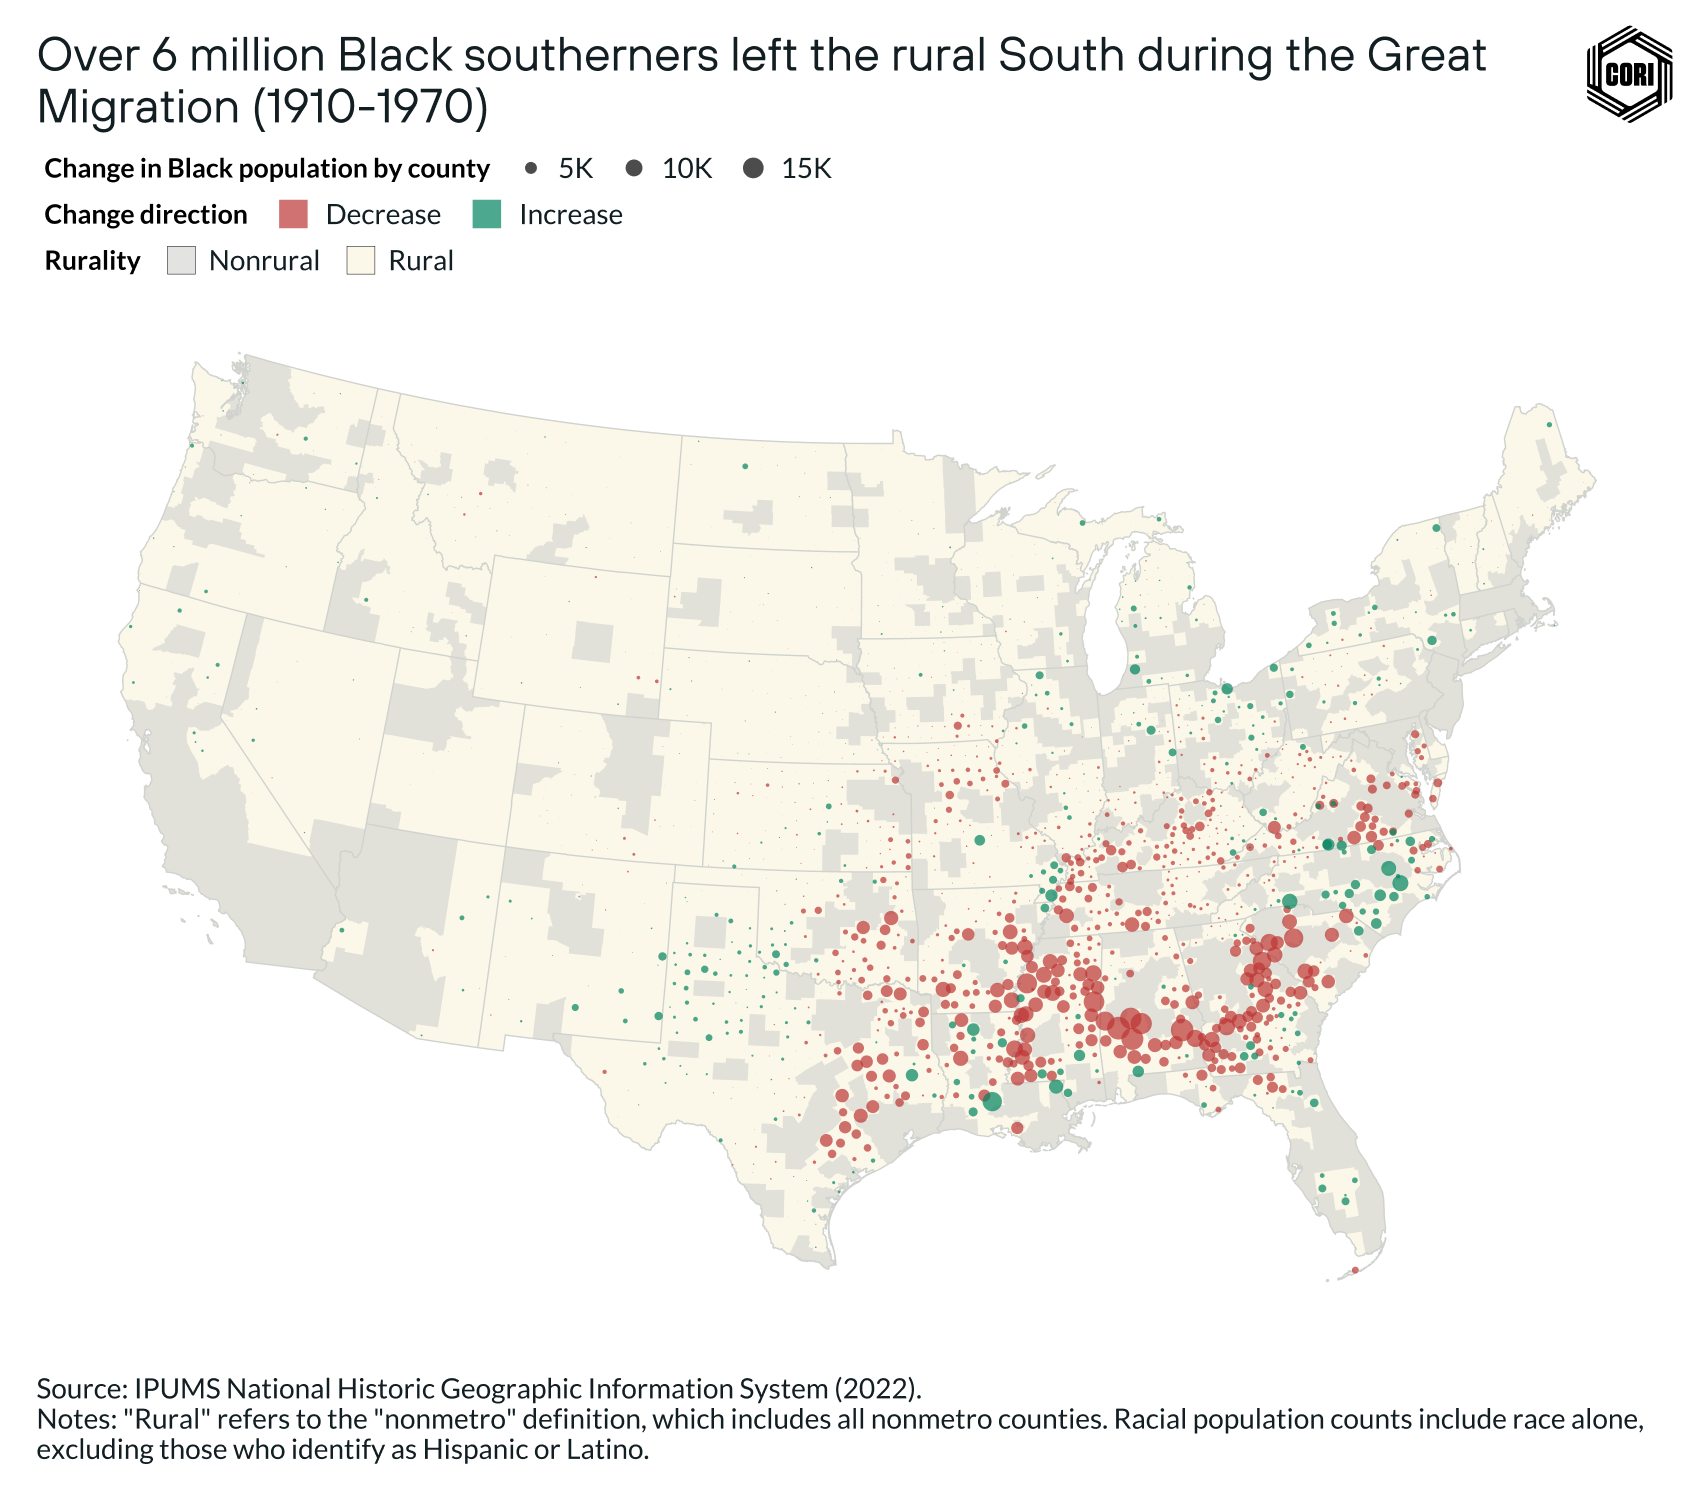
This mass movement of people took place in large part due to the need, and desire, to flee racial violence, to seek greater economic opportunity, and to access basic rights denied in the Jim Crow era — a period in which the Black people were socially and legally “relegated to the status of second-class citizens.” During this period, the rural Black population of the South declined by 26%. Today’s rural areas of Georgia, Alabama, and Arkansas lost more than a third of their Black populations during the Great Migration, while losses were even greater in states like Kentucky, Tennessee, and Oklahoma (below).
While some studies have shown that those who migrated out of the South during this period tended to be relatively young and have higher earnings and education than those who stayed behind, others have found that migrants to the North did not necessarily fare better than those who stayed because of the new economic challenges faced upon moving. While there is significant research on how destination cities fared during and since the Great Migration, there has been much less research on how southern rural communities which lost population have been impacted.
There are several reasons for why so much movement of the rural southern Black population was directed to cities, rather than rural areas, in the North. One motivating factor was the belief that cities offer more job opportunities and resources for people migrating from the rural South, although for many a wealth of opportunity was not the lived reality. As more people moved, cities became hubs and attracted the friends and family of people who migrated in earlier waves.
Another contributor to this settlement pattern in urban areas was the intense discrimination faced by those who opted to move to rural and small-town areas across the country — although intense discrimination was also faced in urban areas. From the late 1800s to the mid-1900s, communities across all regions of the U.S. organized and enacted community-wide cultural practices and violent behaviors that for “for decades kept African Americans or other groups from living in it, and were thus ‘all white’ on purpose.”
Communities with these types of practices became known as “sundown towns,” and in many cases were enforced through violence, others through social ostracization, and in others through official formal ordinance. During this time, Ku Klux Klan activity also spread from the South into areas in the north and the west. Of the more than 1,200 rural counties outside of the south, 65% of them have a known history of sundown town policies or Ku Klux Klan activity (below).
[*Note: While this data provides historical context, it is incomplete and not fully representative of the discrimination and racial violence experienced by Black southerners migrating elsewhere. There are potentially areas where racial violence took place but was not documented in the historical record available.]
In sum, while there has been a significant shift in the overall Black population since the 1860s, the geography of the rural Black population is still highly concentrated in the southern areas of the country.
Going beyond the top-line census numbers on the rural Black population
When incarcerated people are counted by the census, they are counted based on where they are incarcerated, not where they are from. Thus, the rising incarceration rates and the disproportionate incarceration of Black men — both those who are from rural communities, and those who are moved from their homes to be incarcerated in rural jails and prisons — has a significant impact on the rural Black population reported by the census.
Since the 1980s, there has been a 470% increase in the number of people held in jails pretrial, and a 370% increase in people held in state and federal prisons. Between just 2013 and 2019, rural jail populations alone rose by 27%. The incarcerated Black population makes up a disproportionate portion of rural Black populations overall. Using data from the 2020 ACS, we estimate that individuals incarcerated in rural long-term correction facilities accounted for 7% of the overall rural Black population.
In comparison, in metro areas, the Black incarcerated population accounted for 1% of the overall urban Black population (CORI calculation using 2020 ACS). Outside of the south, incarcerated people account for more than 25% of the rural Black population. Many of these people are not from rural areas, but are being held in prisons in rural areas.
As one study found, one-third of inmates who lived in urban areas prior to incarceration ended up being incarcerated in rural areas. There are nearly 170 rural counties with prisons and jails that have at least 100 Black residents, and in which more than half of the Black population is incarcerated (below).
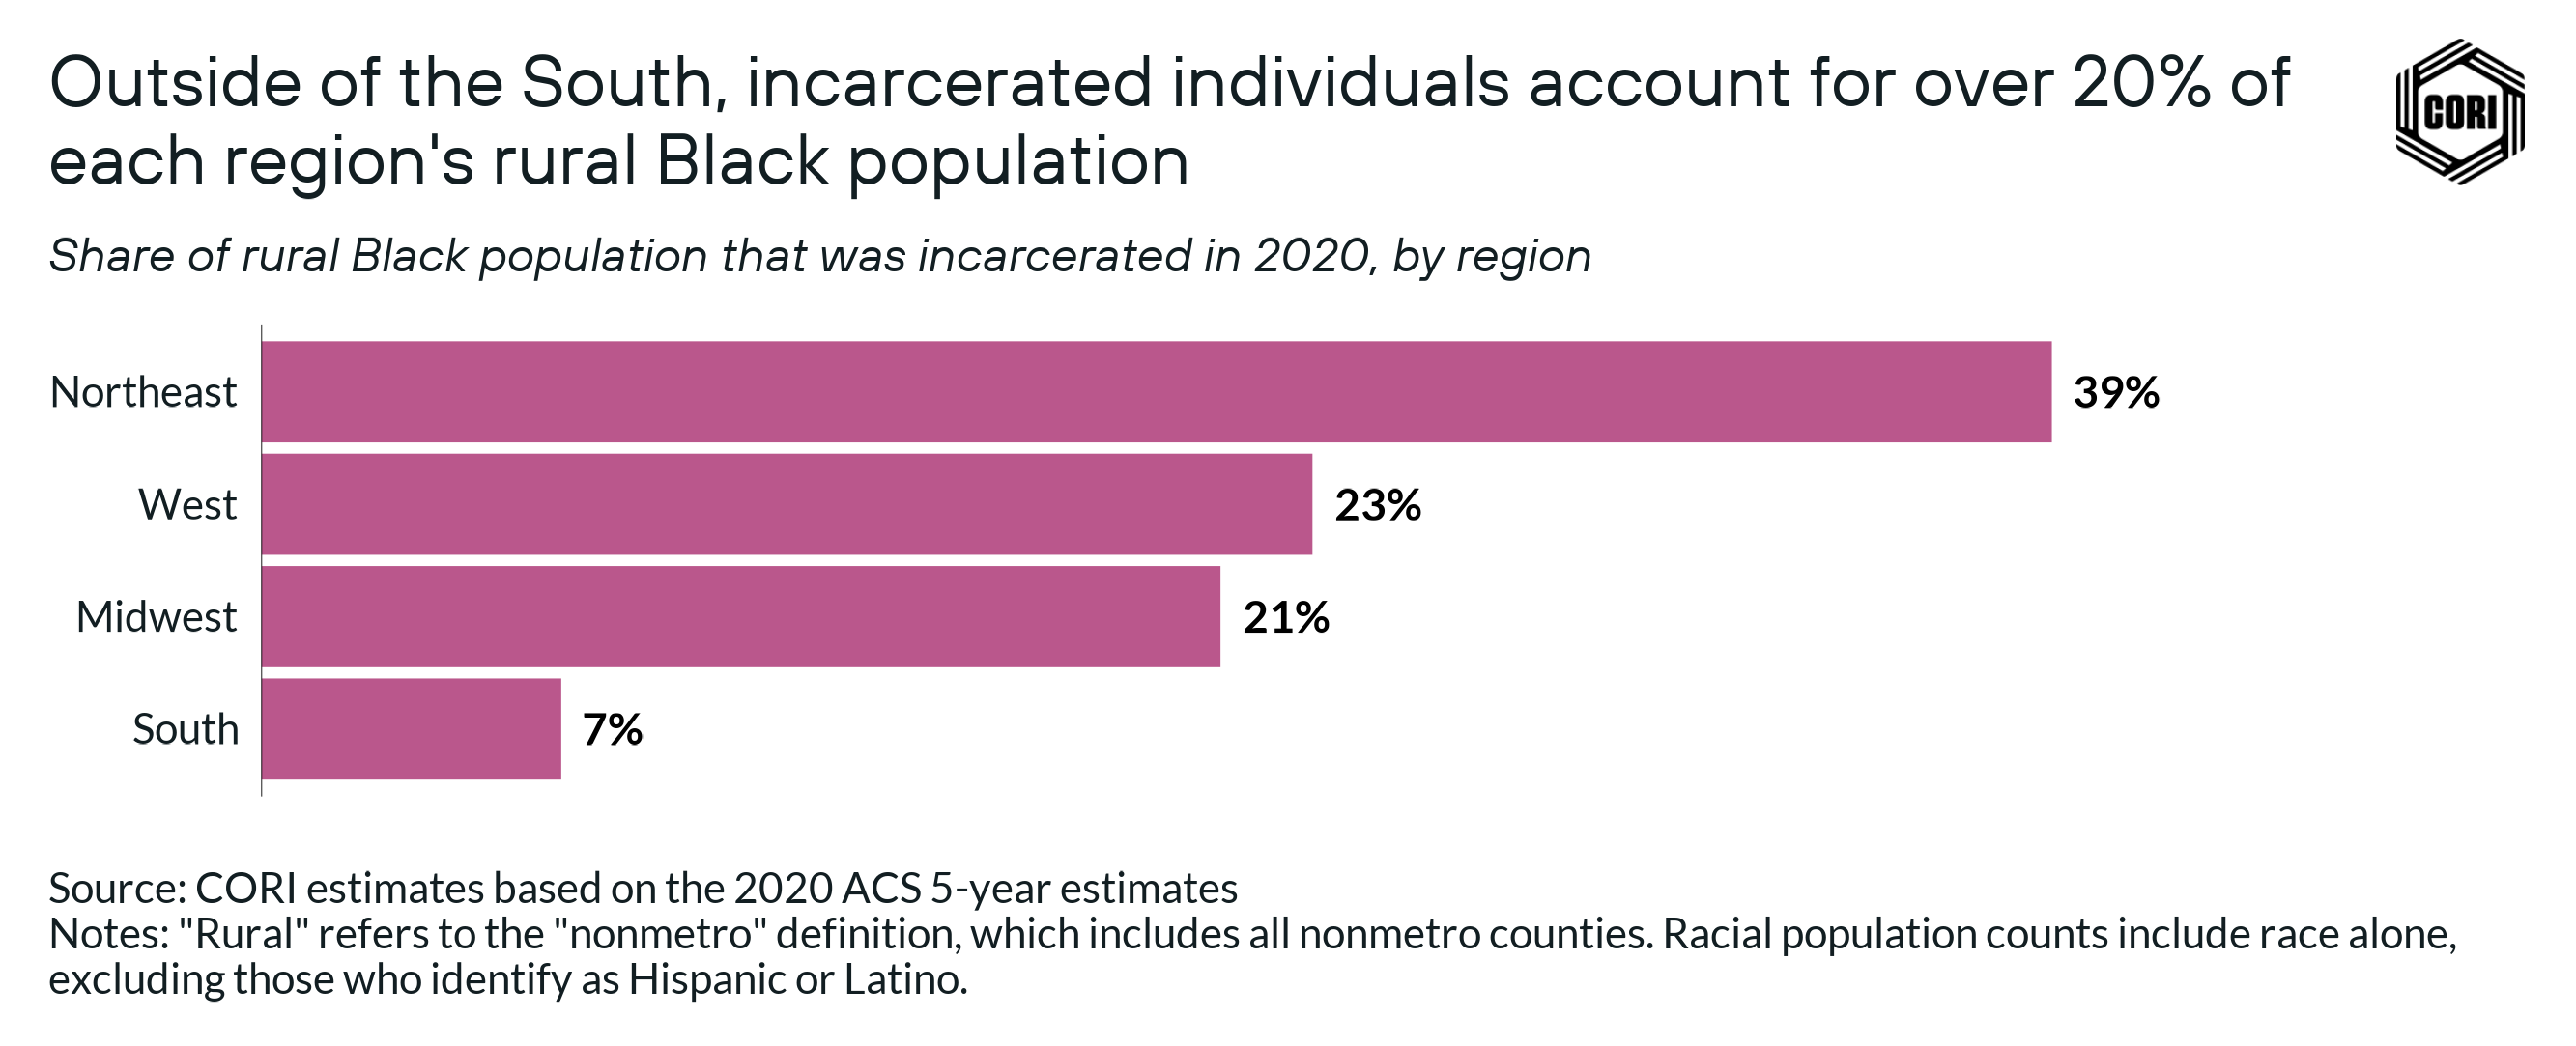
In the Northeast region, 39% of the rural Black population is incarcerated, as compared to 7% in the South (below).
An extreme example of this dynamic can be found in Forest County, Pennsylvania, one of the least-populated counties in the state and the site of Forest State Penitentiary.
The 2020 census reported a Black population in the county of 1,555, representing 22% of the total population. Yet, nearly the entire Black population was incarcerated. Without taking into account the dynamics of the incarcerated population, data on the rural Black population — and other disproportionately incarcerated groups such as Hispanic and Latino people — could be misinterpreted or leveraged for political purposes.
Growth trends of the rural Black population
After a period of growing rural Black populations from 1980 to 2010, the rural Black (alone) population declined again over the past decade (below). There are several contributing factors. First, more Black people are identifying as multi-racial, leading to the population identifying as Black alone to decline.
Yet, even after accounting for this dynamic, the rural Black population fell between 2010 and 2020. This decline was driven by falling rural Black populations in the South. Outside of the South, the rural Black population is growing, but the numbers are small.
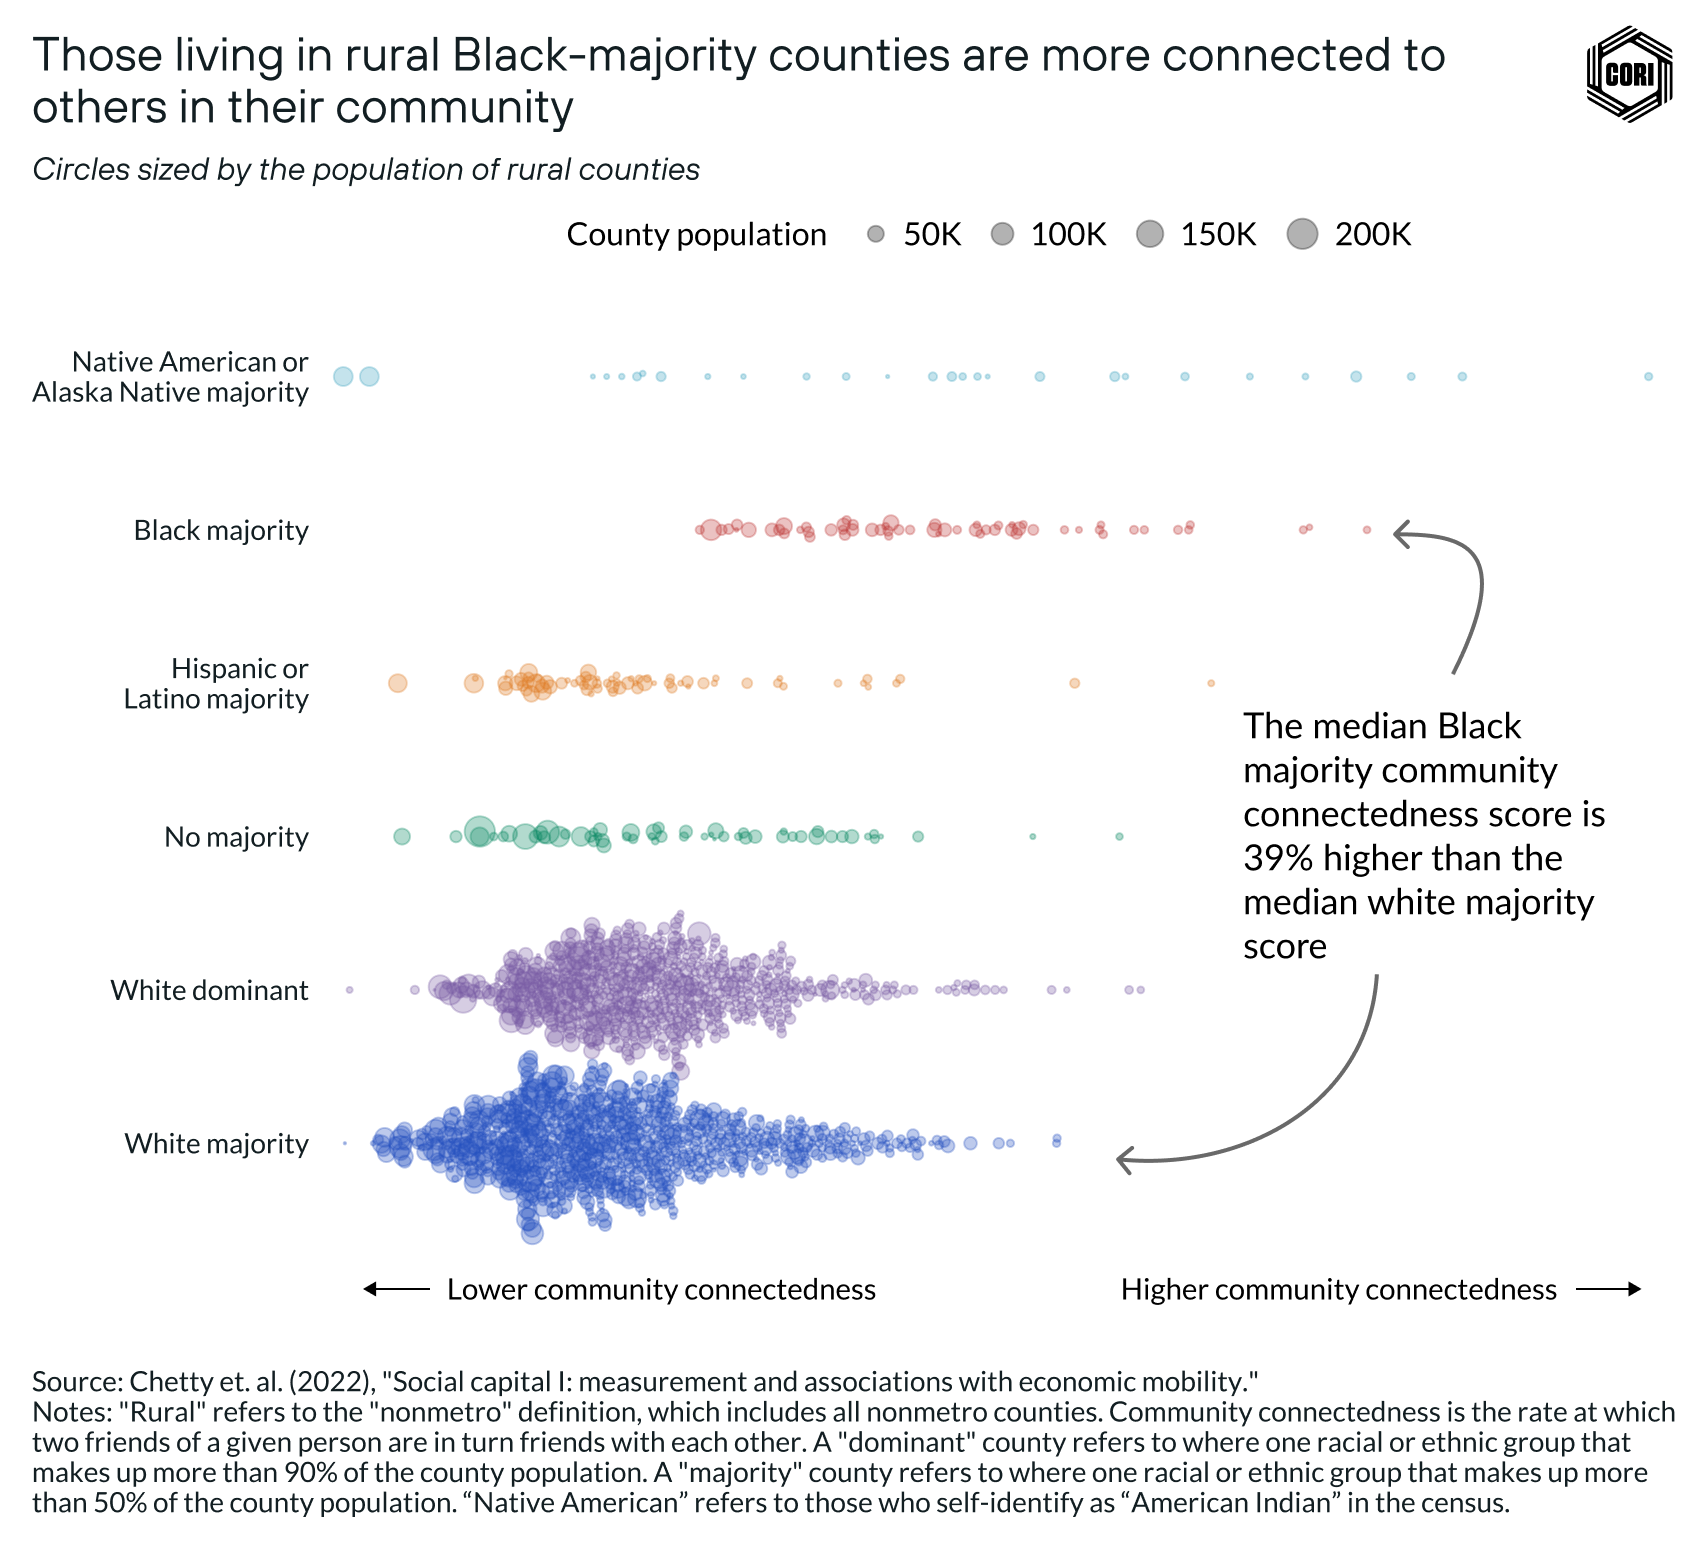
While the history of rural Black communities has been marked by challenges stemming from discrimination, violence, and migration, it has also forged strong and deeply connected communities today. A recent study created a measure for connectedness within a community, using Facebook friends to measure the extent to which within a community “your friends are my friends and my friends are your friends.”
By this measure, rural Black communities are some of the most connected in the country. That data shows that rural counties with a Black majority are 60% more connected than the average U.S. county (below). Furthermore, another study found that Black communities are shown to be the most resilient in the face of decline.
Even in the face of strong connectedness and resilience, population decline is a signal that deserves attention. It can be a sign that certain people see fewer opportunities in rural communities relative to other places – as shown in a recent survey which found that rural Black residents are less likely to feel positively about their communities than rural white people.
Declining populations can also be a leading indicator of future community challenges, as tax bases fall and demand for local businesses declines. But even among communities that are facing economic and social challenges, community connectedness is something that can be fostered and strengthened through intentional investment and much-needed attention.
![]()
The Hispanic and Latino population in rural America
Summary of data takeaways:
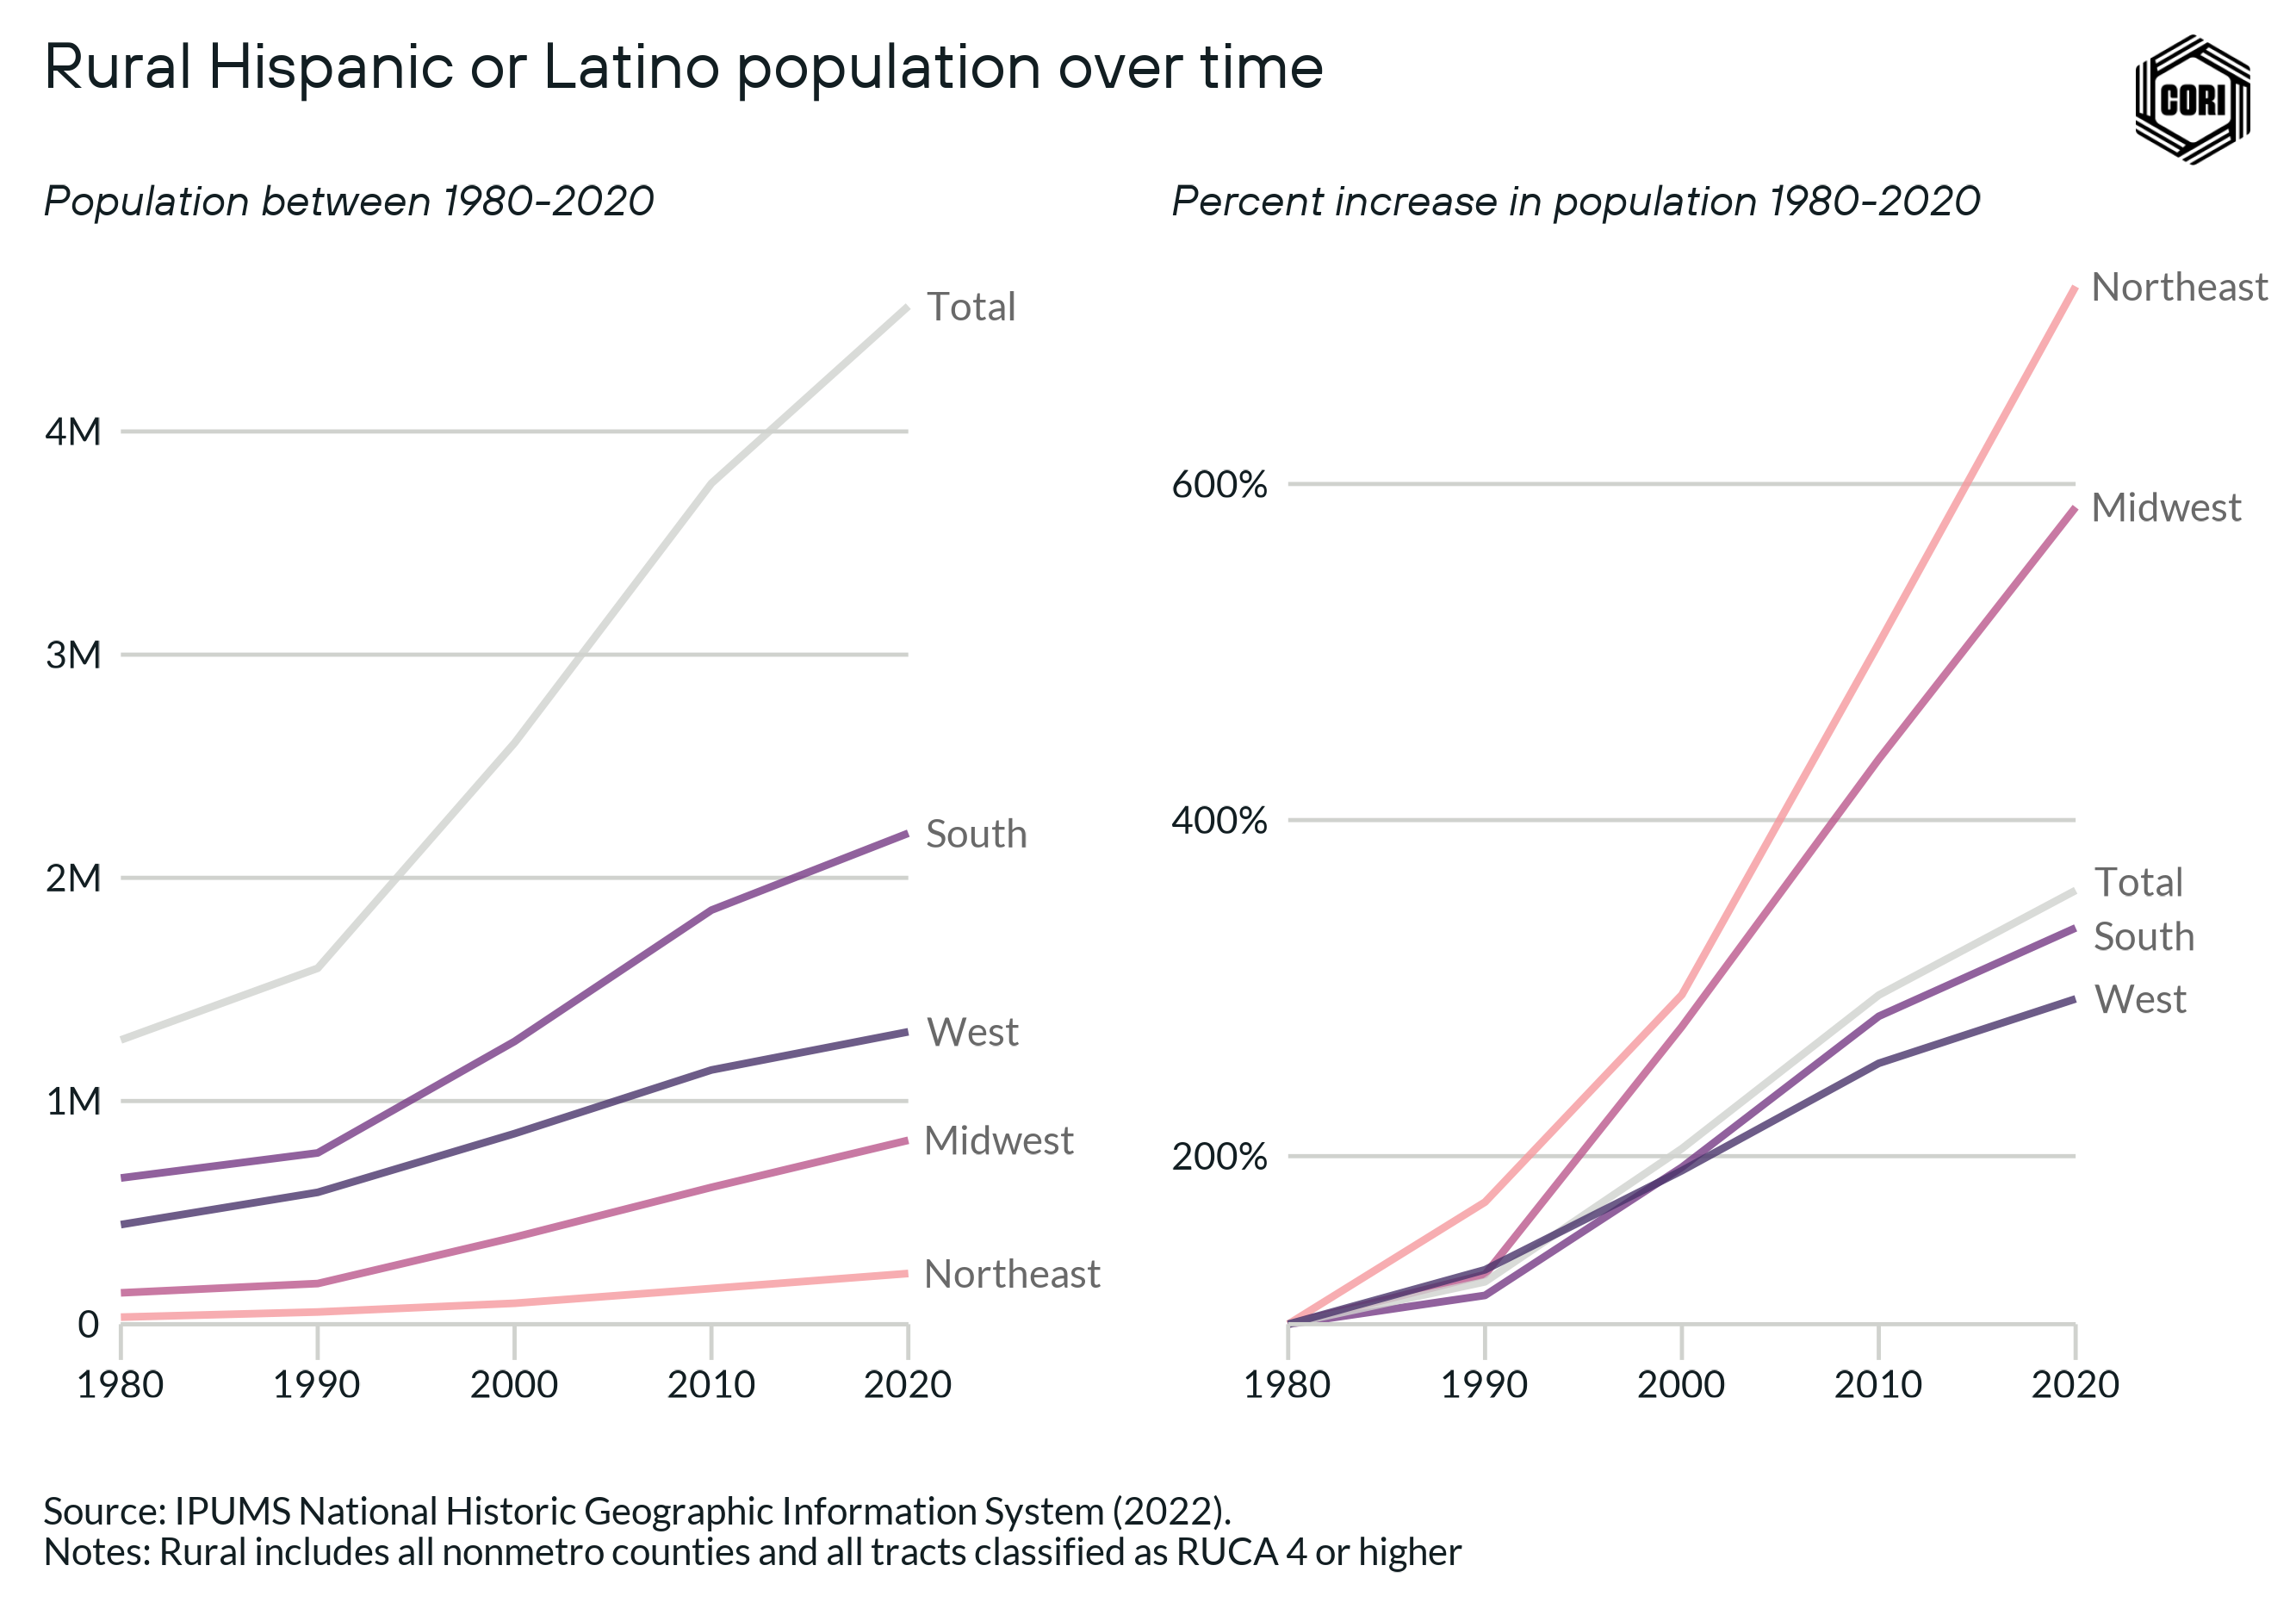
- In 2019, there were 5.8 million Hispanic and Latino people living in rural America, accounting for 10.3% of the rural population.
- Over the past decade, rural Hispanic and Latino populations have grown in every state but Arizona — but this growth has not impacted all rural areas equally. Almost half of the growth in rural Hispanic and Latino populations has occurred in just 10 states, and 20% of total rural Hispanic and Latino population growth occurred in Texas and California alone.
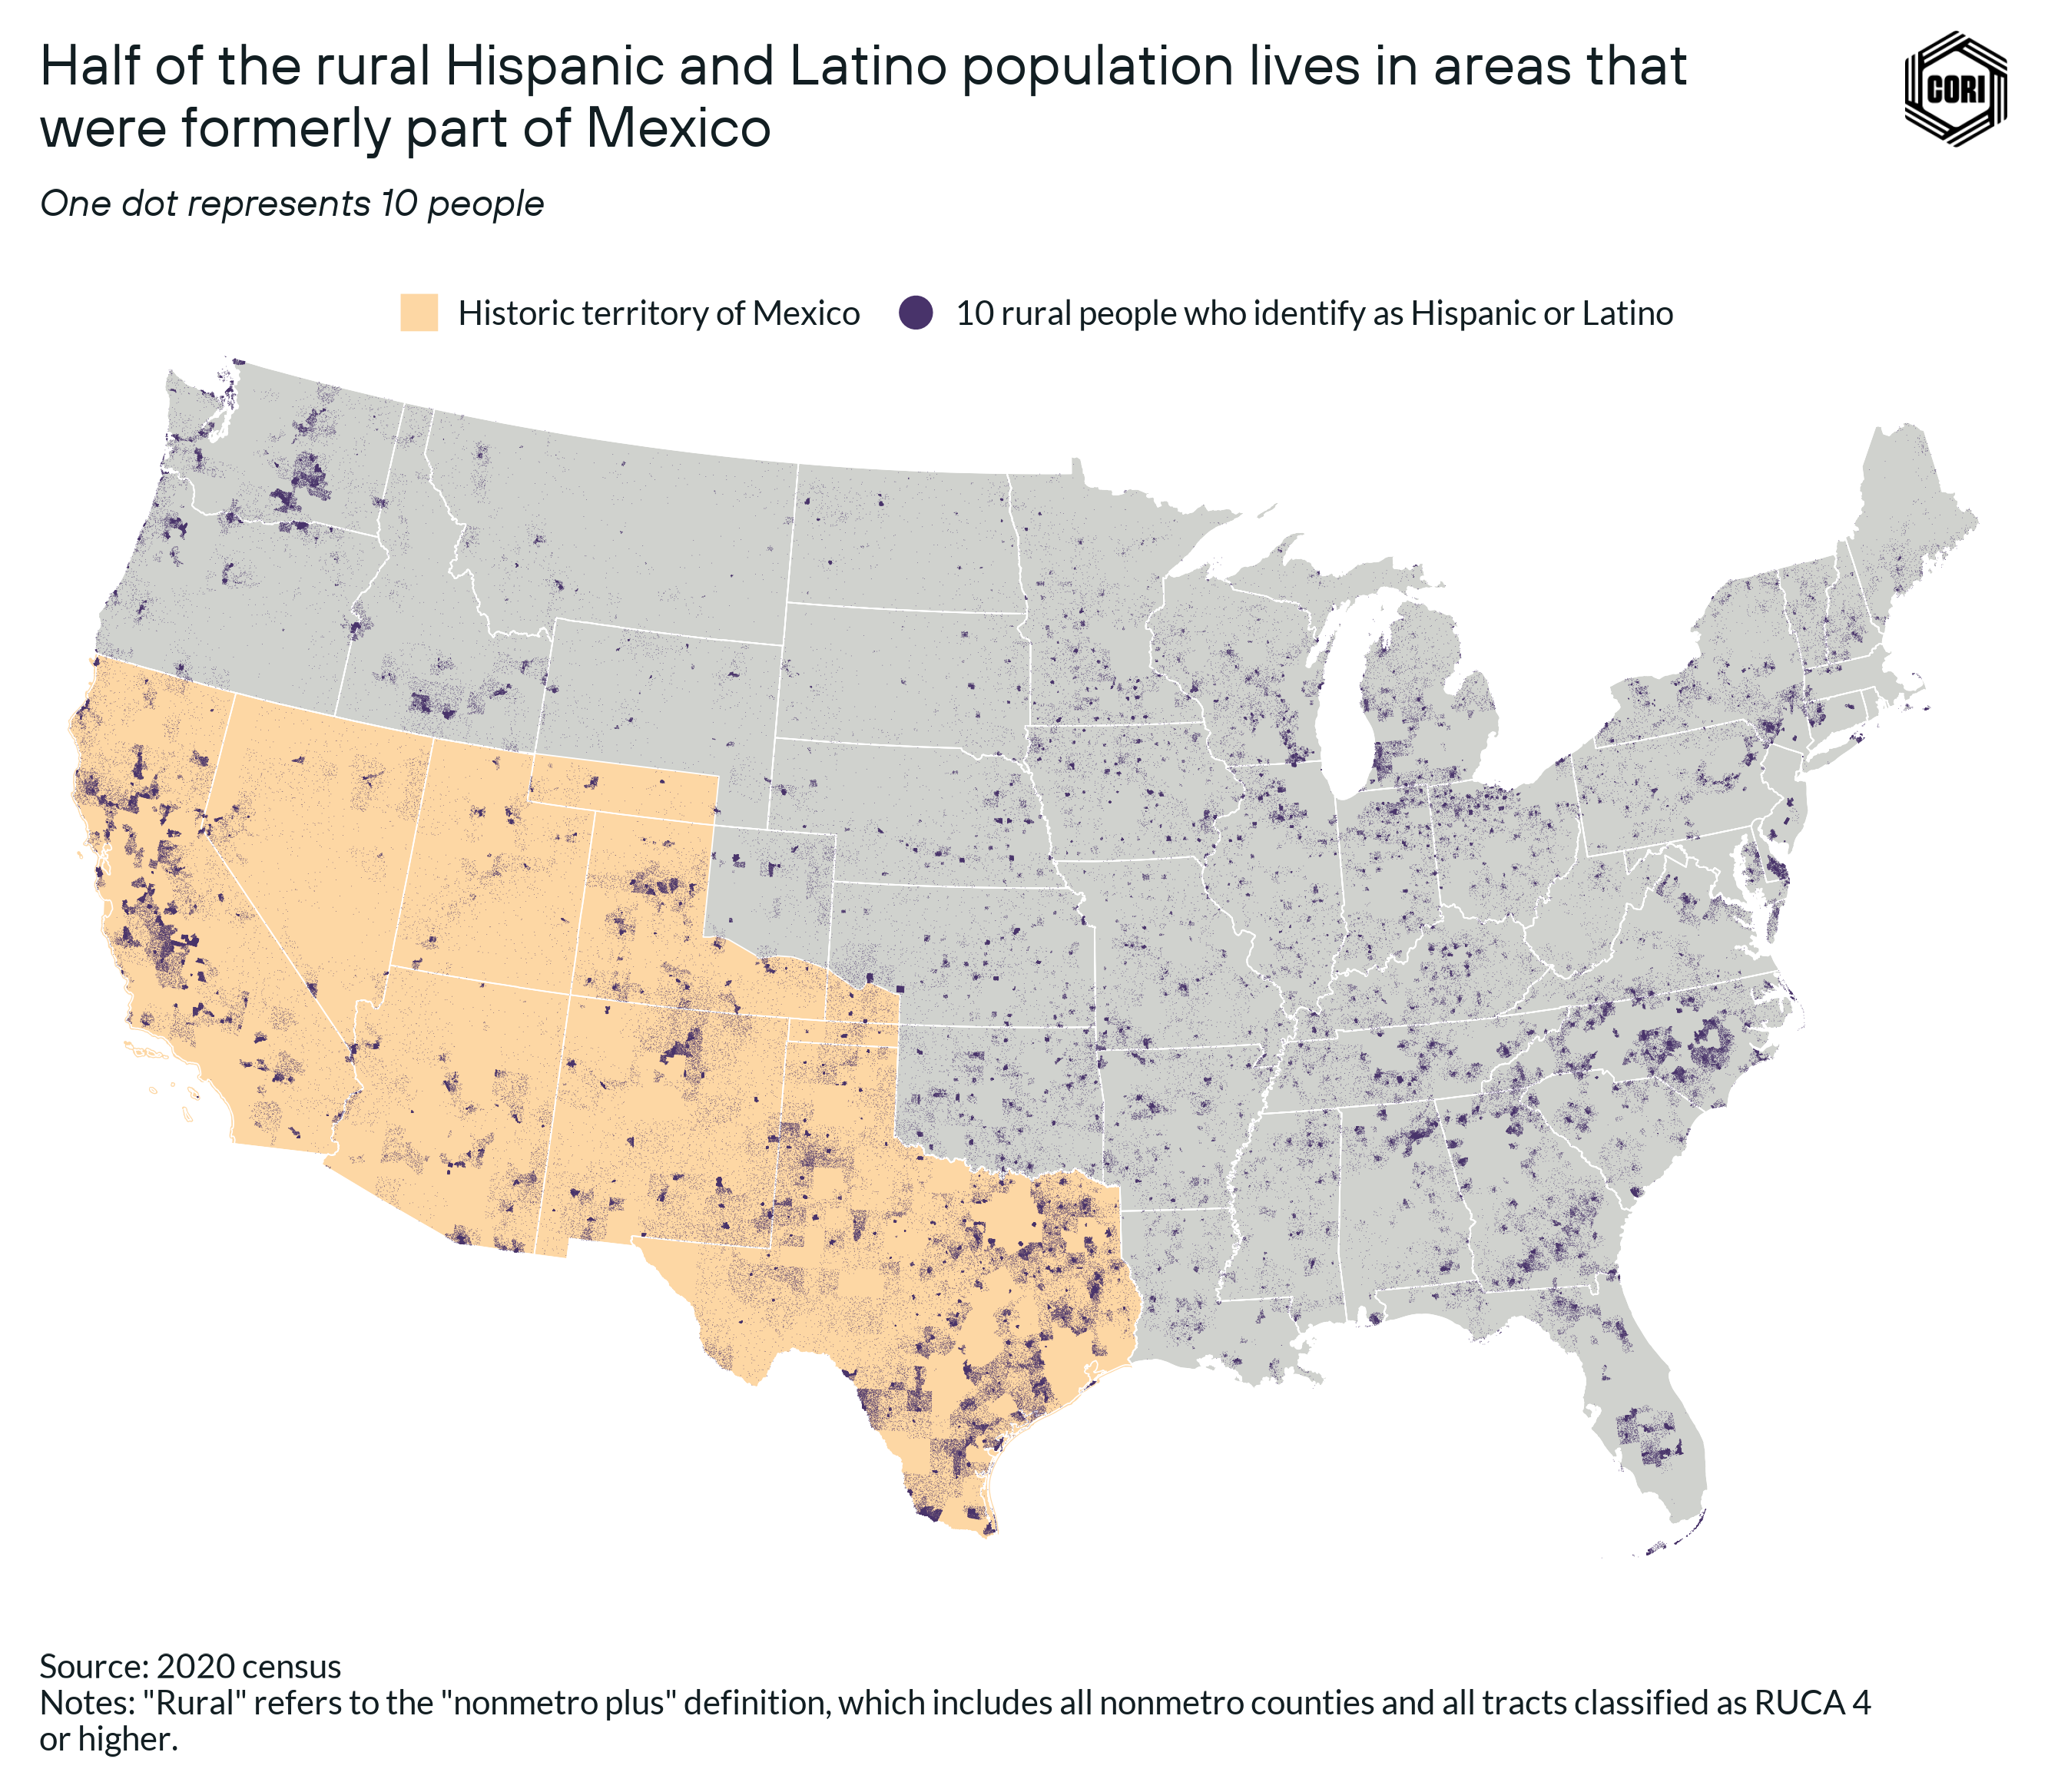
- Half of the rural Hispanic or Latino population in the U.S. lives in areas that were formerly part of Mexico, comprising over 30% of the current rural population in that region.
- Foreign-born immigrants account for 25% of the rural Hispanic and Latino population, compared to 33% nationally.
- Three out of every four Hispanic or Latino people (75%) living in rural America either immigrated from or have roots in Mexico.
- Nationally, nearly 14% of the Hispanic or Latino population lives in a county with substantial employment in the meatpacking industry (>5% of county employment). This compares to around 8% of the white population, and 9% of the total population that lives in these counties.
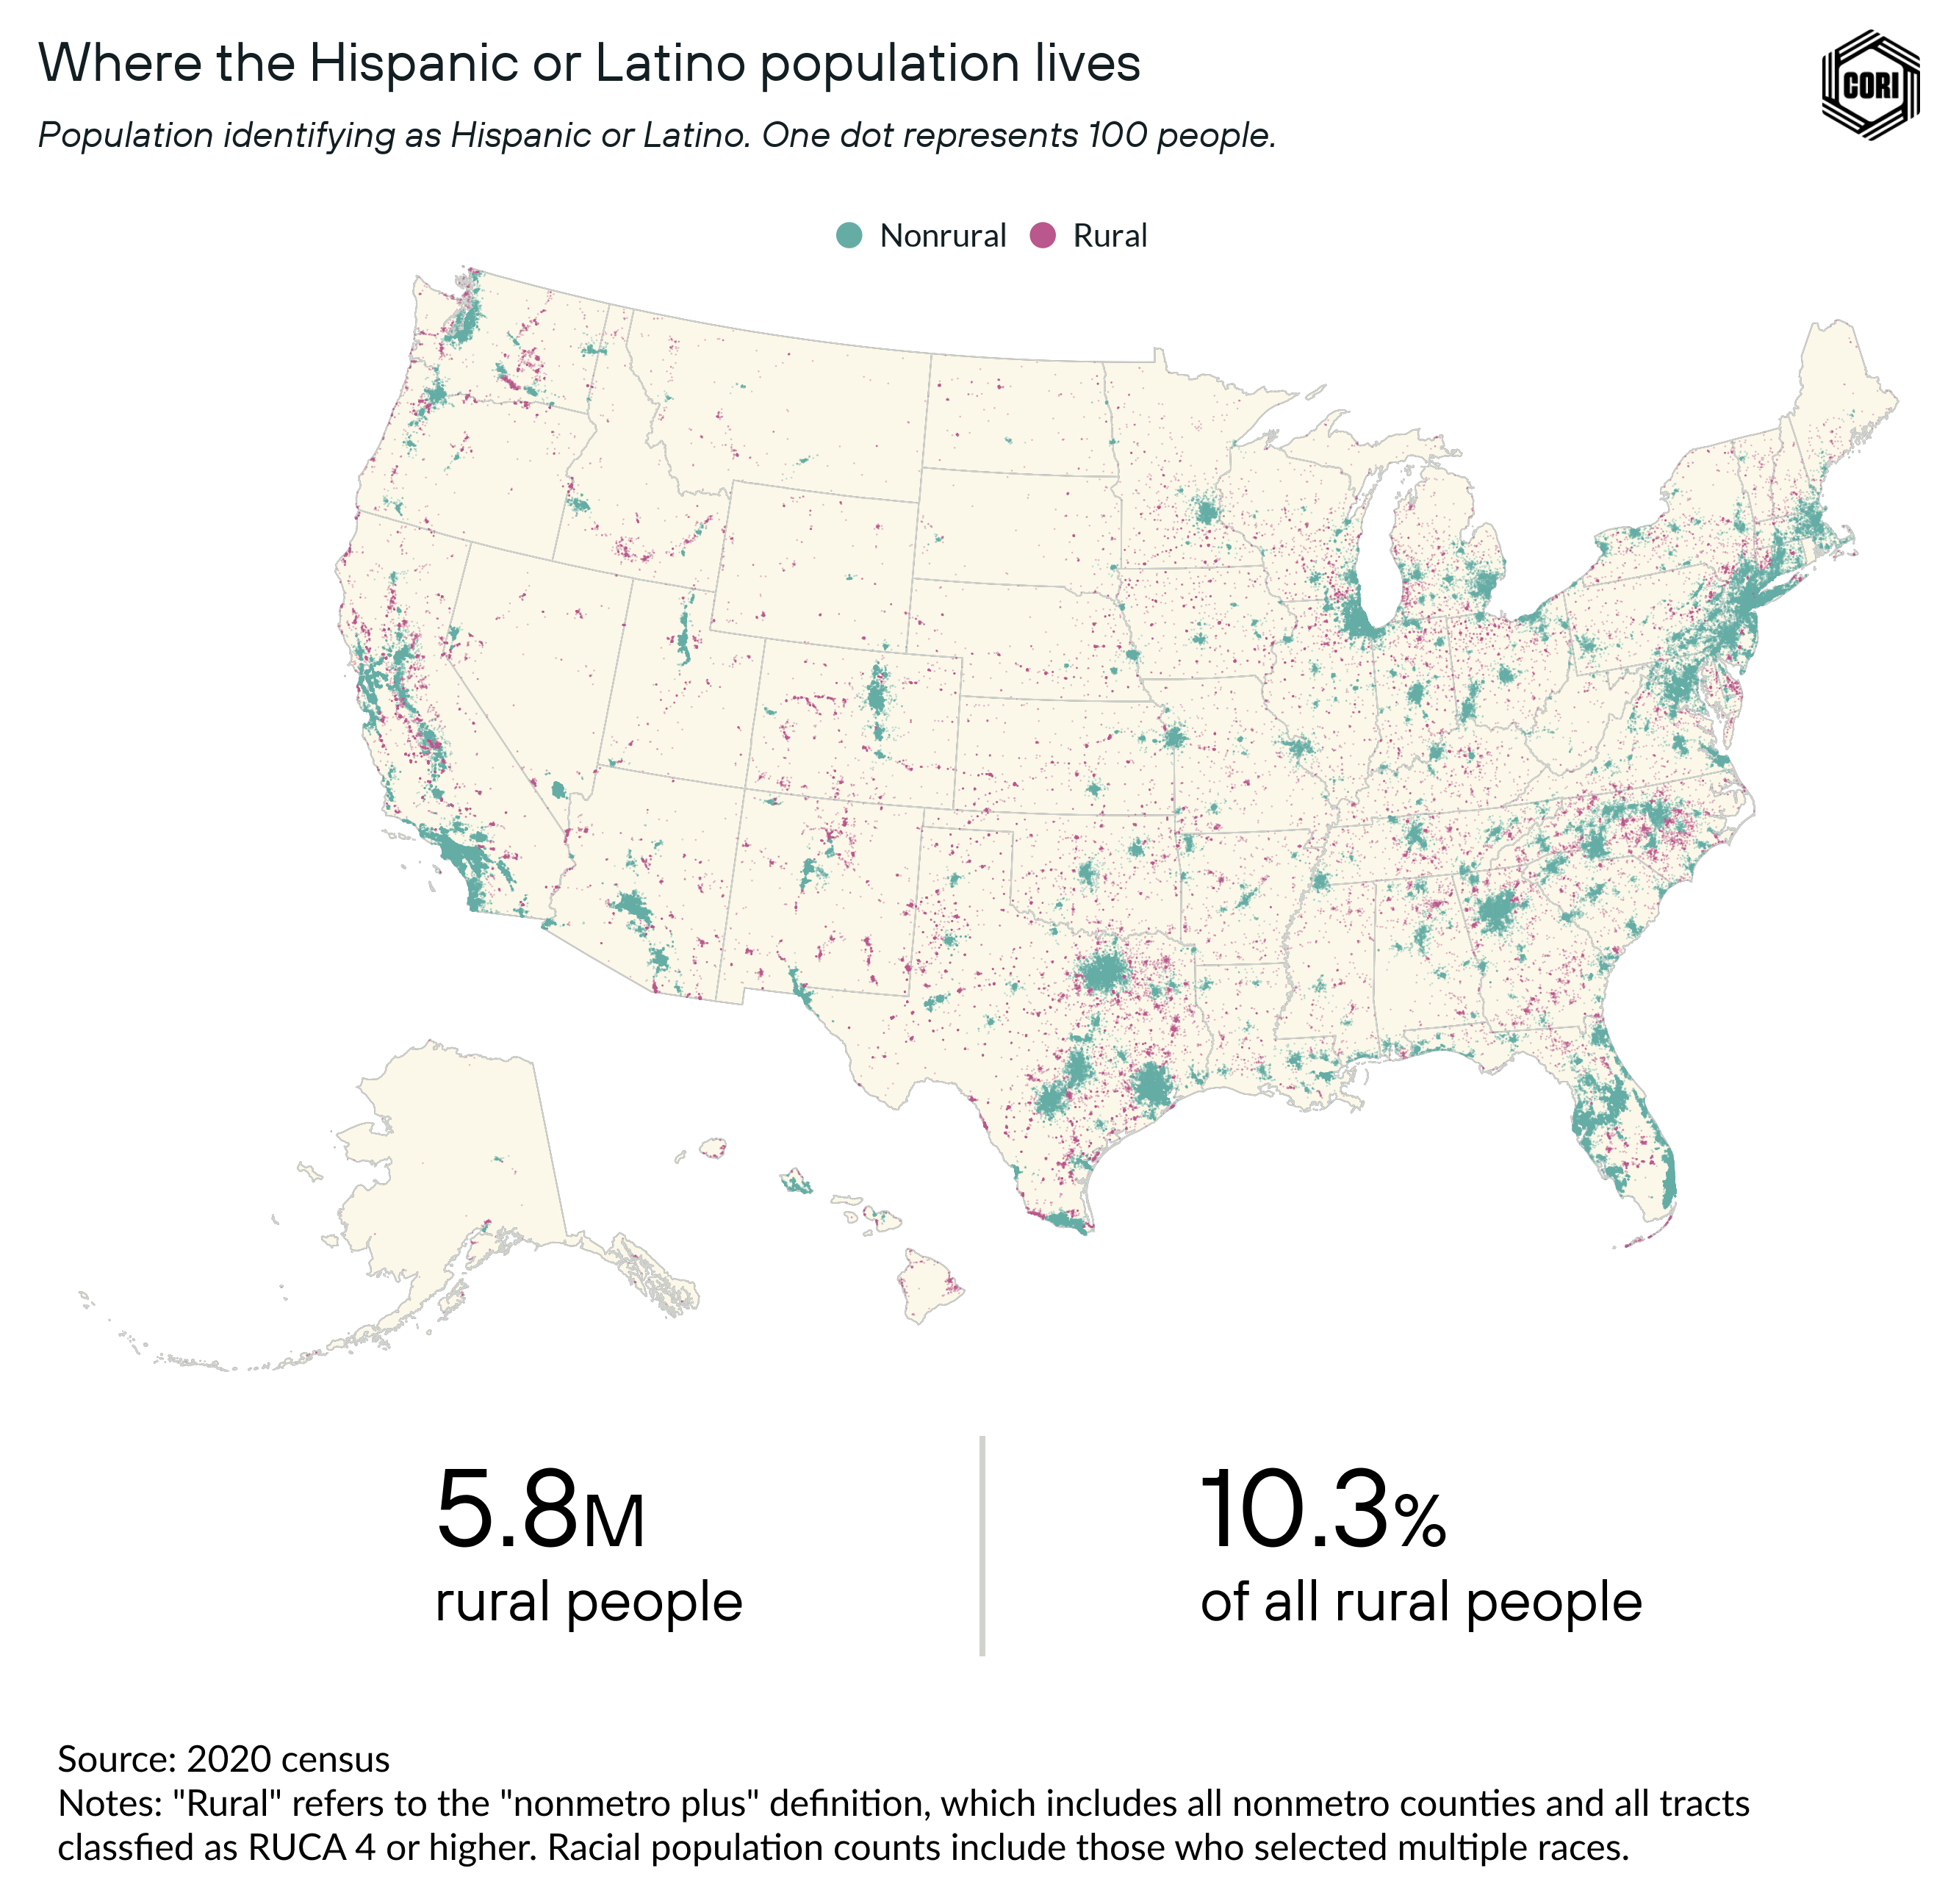
In 2019, there were 5.8 million Hispanic and Latino people living in rural America, accounting for 10.3% of the rural population (above). Contemporary Hispanic and Latino populations represent the largest and fastest-growing demographics in rural places. More broadly, Hispanic and Latino people accounted for 52% of the growth of the U.S. population between 2010 and 2021.
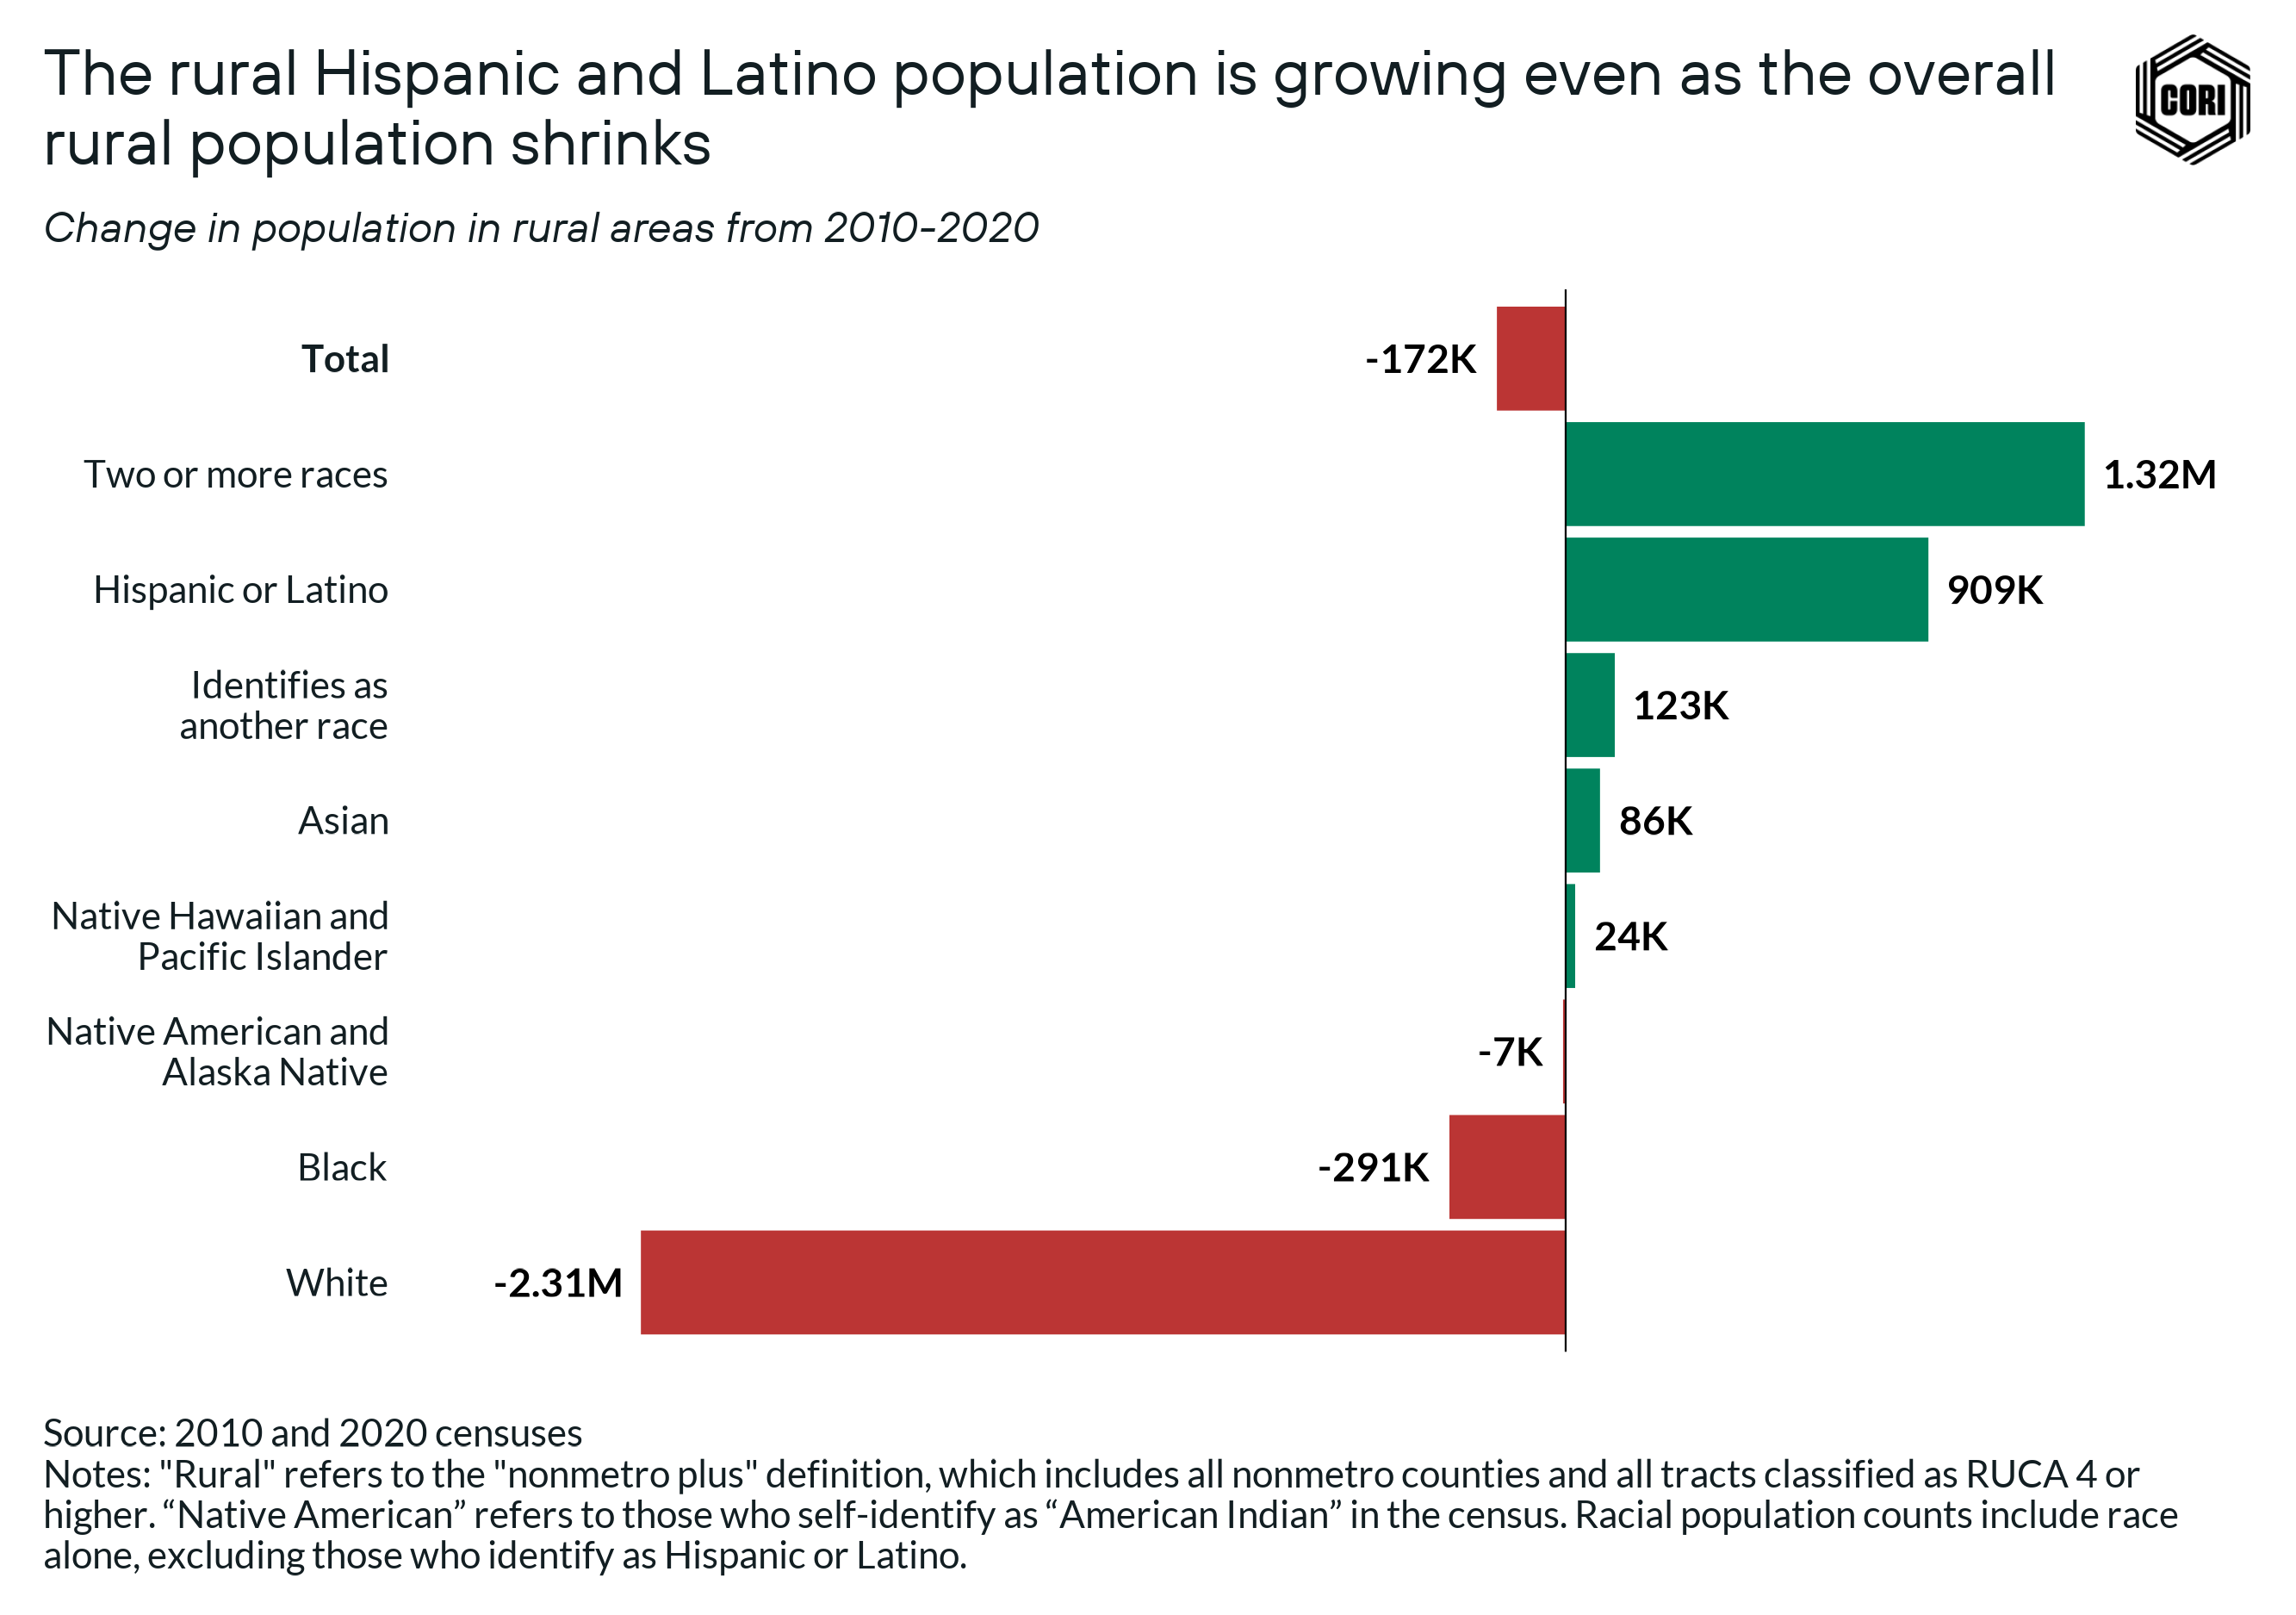
Despite the fact that the rural population as a whole fell for the first time in history, rural Hispanic and Latino populations grew by more than 900,000 people (below). Across many rural communities, Hispanic and Latino populations have been growing both in size and share of the local population.
How the U.S. census defines “Hispanic or Latino”
Hispanic and Latino identity is considered an ethnicity, and not a race, by the U.S. Census Bureau. The current category is defined as representing “a person of Cuban, Mexican, Puerto Rican, South or Central American, or other Spanish culture or origin regardless of race.” In the 2020 census, the category was framed as “Hispanic, Latino, or Spanish origin” with options to check boxes for “Mexican, Mexican American, Chicano,” “Puerto Rican,” “Cuban,” or the ability to write in another origin. Since the census considers Hispanic or Latino as an ethnicity, Hispanic and Latino people can identify as any race.
The census first began recognizing people of Hispanic or Latino descent in 1930, when “Mexican” first became a category (but was then dropped for several decades). Hispanic and Latino representation was then reintroduced in the 1970s, framed as “Origin or descent: Mexican, Puerto Rican, Cuban, Central or South American, or Other Spanish.”
As Hispanic and Latino populations have grown, the number of ways to identify as Hispanic or Latino has expanded.
Factors that have shaped the rural Hispanic and Latino population today
When it comes to understanding the geography of Hispanic and Latino people living in rural America, there are three specific, yet interconnected, historical factors to consider: land, migration, and labor.
What we currently perceive as the boundaries of the U.S. were not always as such, and European colonization and conflict between the American and Mexican governments greatly shaped the places where people of Latino descent live stemming back to the 1500s. The first European settlement in the U.S. was in the mid-1500s in St. Augustine, Florida, and throughout the 1600s and 1700s, more and more Spanish settlements arose throughout the U.S., including through religious missions across Texas.
The boundaries of the U.S. began to resemble more what we see today starting in the 1800s, as the result of a series of conflicts, treaties, and selling of land. The U.S. annexed Texas from Mexico in 1845, sparking the conflict that would become the Mexican-American War. This conflict ended with the treaty that led to the U.S.’ acquisition of nearly all the land that is now California, Arizona, New Mexico, Colorado, and Utah, and in the 1850s, the U.S. purchased a portion of land from Mexico between Arizona and New Mexico.
Although land boundaries were shifting, people’s ties to different areas of land did not inevitably change. Throughout this period, many indigenous Mexicans were displaced from their land, and many others stayed and adapted to a changing border region.
Today, there is still a significant overlap between the historic boundaries of Mexico and the rural geography of Hispanic and Latino people (below). Certain areas of historic Spanish settlements — like Taos, New Mexico — continue to be the home to many rural Hispanic and Latino people today. Half of the rural Hispanic or Latino population in the U.S. live in areas that were formerly part of Mexico, comprising over 30% of the current rural population in that region (2020 census-nonmetro plus).
In the past several decades, Hispanic and Latino populations have become more dispersed as Hispanic and Latino people have increasingly migrated to other rural areas of the country in which there are job opportunities.
The push and pull factors of Latin American migration are complicated and intertwined, ranging from historical tradition, to proximity to jobs, to family connections, to the impacts of U.S. foreign policies, to domestic immigration policies, among others. But a major reason for migration both from other countries and within the U.S. has been the desire, and often necessity, to pursue work opportunities and economic livelihoods.
U.S. companies and the federal government both have a history of intense recruitment efforts to bring Latino immigrants to rural areas for labor-intensive, low-wage jobs. In some cases this work has been more temporary — like the Bracero program between 1942-1964, which brought temporary agricultural workers from Mexico primarily to the Southwest — and in others more permanent.
The meatpacking industry is one contemporary example of a more permanent draw for Hispanic and Latino migration to rural areas. Since the 1990s, industrial restructuring in industries adjacent to and outside of agriculture has increased the demand for low-wage labor into other parts of the country — notably the rural Midwest and South. Alongside shifts in migration policies, the growing demand of the meatpacking industry has contributed to a large shift from Latinos being clustered in urban areas in the West and Southwest to being more distributed across rural areas throughout the country:
- Nationally, nearly 14% of the Hispanic or Latino population lives in a county with substantial employment in the meatpacking industry (>5% of county employment) (below). This compares to around 8% of the white population, and 9% of the total population that lives in these counties.
- If we look at rural counties outside of the Southwest, over 18% of Hispanic or Latino people live in counties with substantial employment in meatpacking, as compared to just 9% of rural people overall.
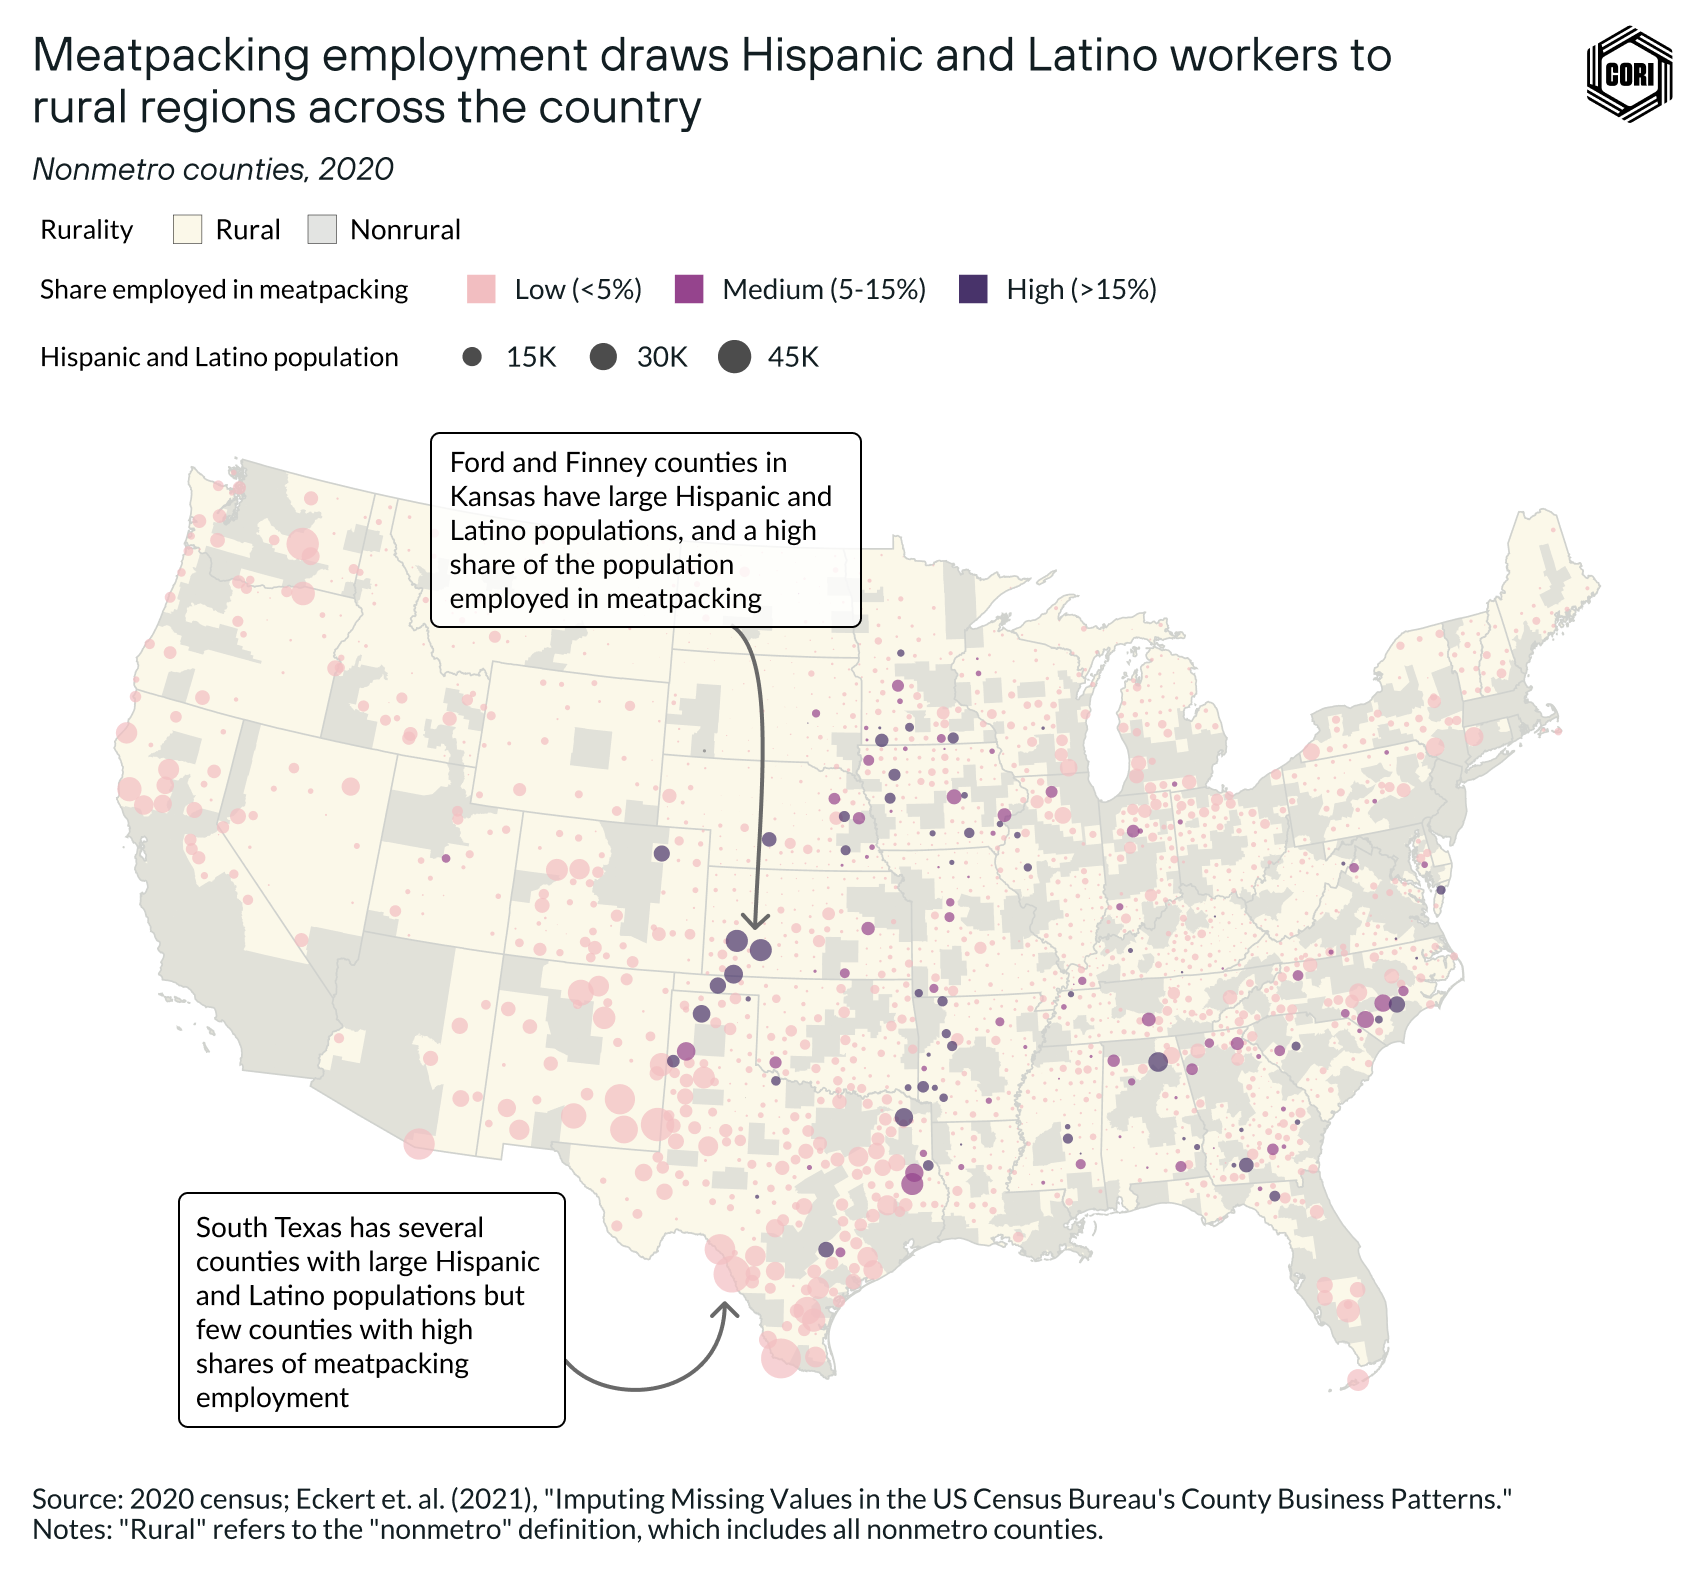
This shows how a labor-intensive industry like meatpacking — which has long been known for its poor working conditions (as reported by both investigative organizations and legislative committees) — employs a disproportionate portion of Hispanic or Latino workers, pulling Latino migration to rural counties and contributing to population growth. Migrants that start working in labor-intensive industries like meatpacking, and their families and friends that move with them, often end up working in other local industries, or starting businesses of their own.
Going beyond the top-line census numbers on the rural Hispanic and Latino population
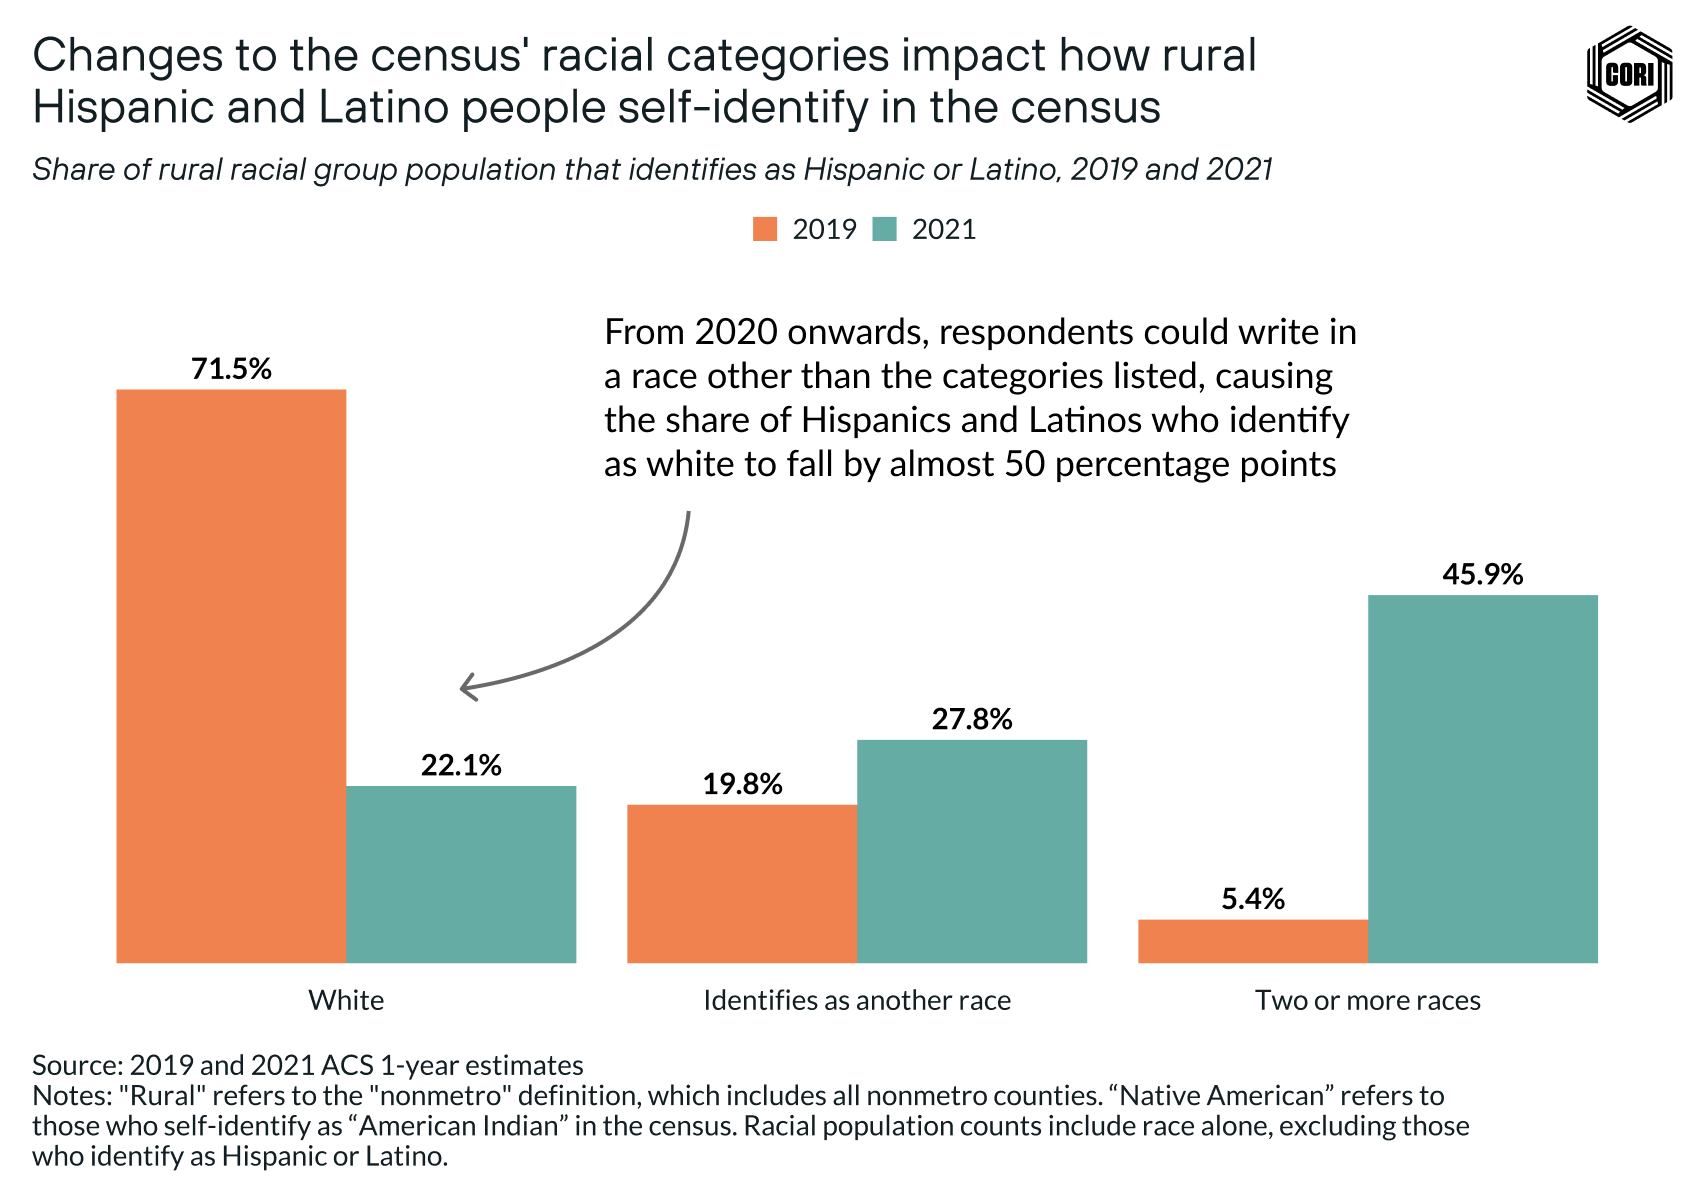
Historically, the majority of Hispanic or Latino people have identified in the census as white: In the 2019 American Community Survey, that number reached 71% (below). In 2020, the census introduced a new option to write in a race other than the categories included. This resulted in a major shift in the reported racial demographics of the rural Hispanic population.
In the 2021 American Community Survey, just 20% of Hispanic or Latino people identified as white, while nearly 70% identified as “some other race” either alone or in combination with another race. These changes are aimed at better representing the identities of the respondents, but they also complicate our ability to use census data to understand or track the racial composition of rural Hispanic and Latino populations over time.
Disaggregating data on Hispanic and Latino populations offers critical insights in how the rural Hispanic and Latino populations are similar and different to the national Hispanic and Latino populations. For example, whether a person is native or foreign-born, and the country where a person or their family immigrated from impacts an individual’s experiences, opportunities, and challenges.
In these dimensions, there are important differences between the rural and national Hispanic and Latino populations. First, rural Hispanic and Latino people are less likely to be foreign-born: Foreign-born immigrants make up 25% of the rural Hispanic and Latino population, compared to 33% nationally (2020 ACS).
In rural places, the majority of rural Hispanic and Latino people overall are Mexican (including both foreign-born and native): Three out of every four Hispanic or Latino people (75%) living in rural America have roots in Mexico compared to 60% nationally (2020 ACS-nonmetro). Across rural America, there is no other racial or ethnic group that is made up of such a high percentage of people from one country of origin — a fact which speaks to the strong, long, and interconnected history between the places that are now Mexico and the U.S.
In addition, it is critical to consider the impact of different rural definitions when working with data on rural Hispanic and Latino populations. Rural Hispanic and Latino people disproportionately live in areas that are likely to be left out of the commonly used nonmetro definition of rural. Correcting for this issue by using the nonmetro plus definition used in our analysis shows that rural Hispanic and Latino populations are as much as 40% larger compared to the nonmetro definition.
Growth trends of the rural Hispanic and Latino population
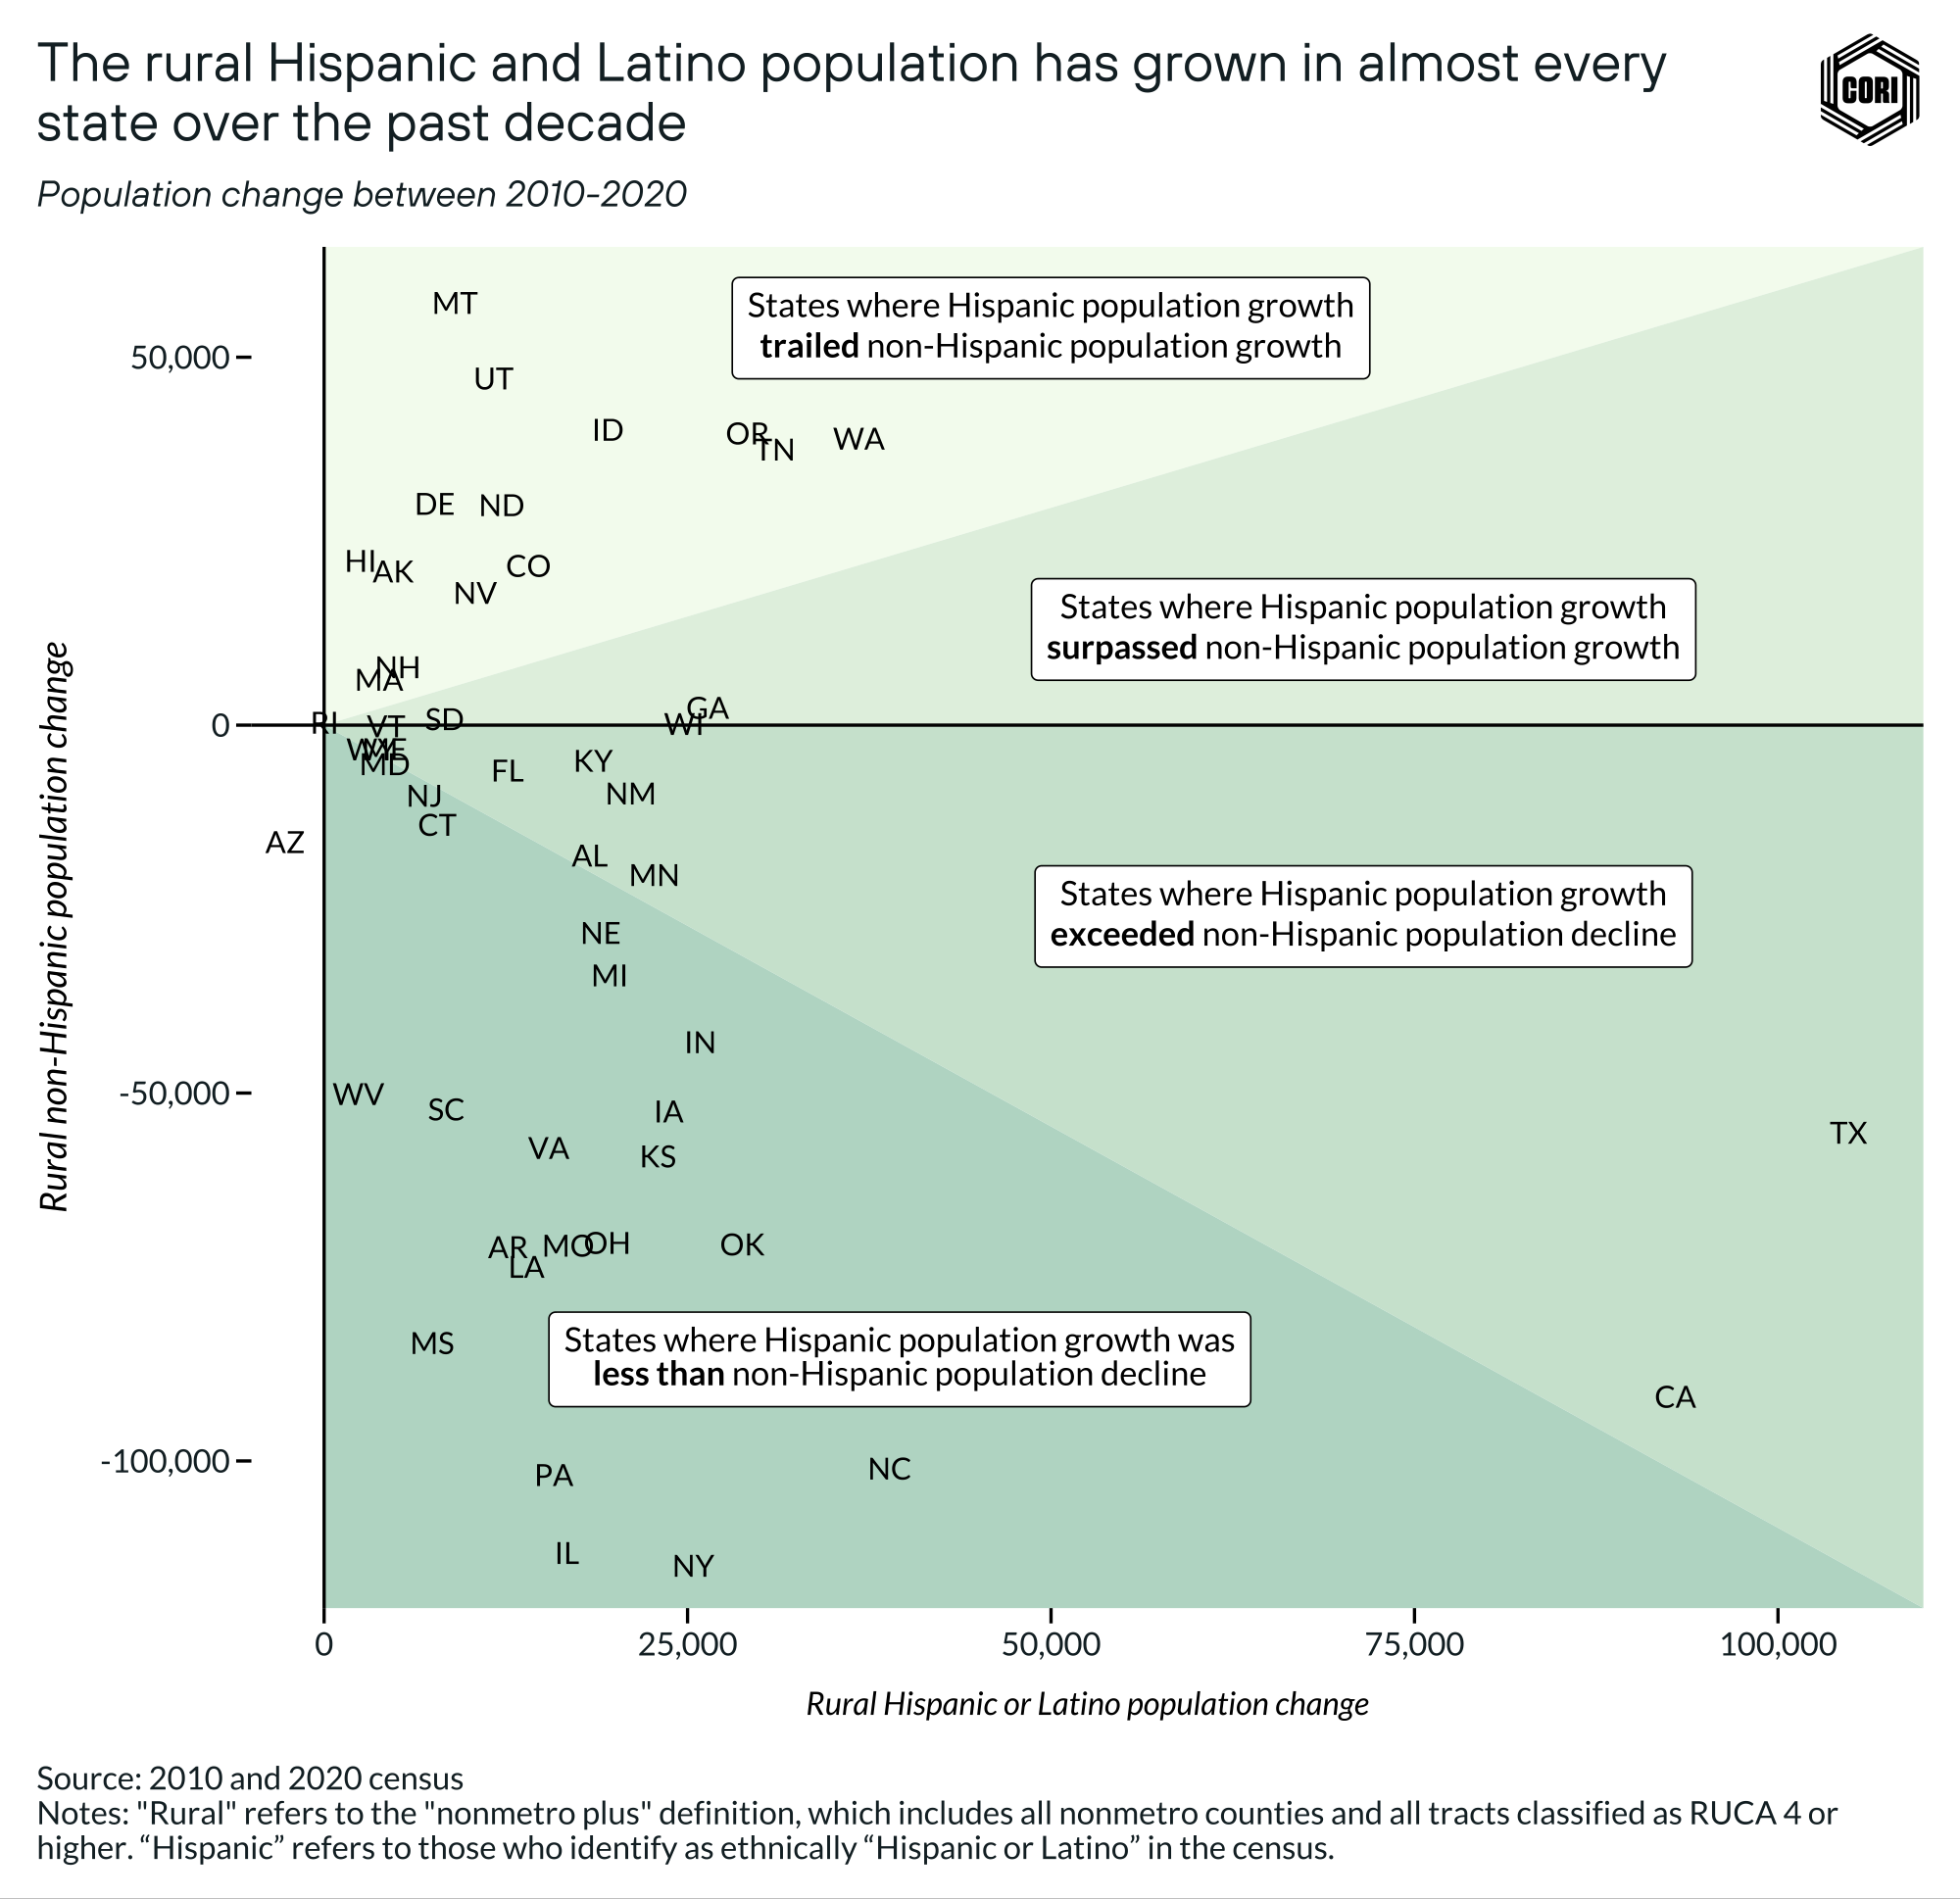
Growing Hispanic and Latino populations have been critical to offsetting rural population declines among other groups. Over the past decade, the rural Hispanic population has grown in every state but Arizona — but this growth has not impacted all rural areas equally: Almost half of the growth in rural Hispanic and Latino populations has occurred in just 10 states (2020 census-nonmetro plus). Over 21% of the total rural Hispanic and Latino population growth occurred in Texas and California alone (2020 census-nonmetro plus). The graphic below portrays this growth:
- As shown in the top triangle, there are 15 states where the non-Hispanic or Latino population is growing faster than Hispanic and Latino populations. But even in these states — including Utah, Montana, and Idaho — Hispanic and Latino populations are still increasing, accounting for over 21% of the national growth in the rural Hispanic population (2020 census-nonmetro plus).
- As shown in the middle triangles, in 12 states, the growth in the Hispanic or Latino population either offset declines or greatly exceeded growth in other populations, contributing to the overall rural population growth.
- As shown in the bottom triangle, in roughly half of states, gains in rural Hispanic and Latino populations were not large enough to offset declines in the non-Hispanic or Latino population. This led to an overall decline in the rural population. In these states, the Hispanic and Latino share of the rural population is growing.
Age and migration are both prominent factors driving why current rural Hispanic and Latino populations are rising at faster rates than other groups (with “migration” referring to both movements from foreign countries into the U.S., and internal migration from more urban areas to more rural areas).
As recent analyses show, newborns account for an increasing proportion of the growth in Hispanic and Latino populations of the U.S — in other words, Hispanic and Latino populations are relatively young. Although the number of Hispanic and Latino immigrants increased between 2007 and 2021, the national share of immigrants that made up Hispanic and Latino populations declined from 40% to 32% as the number of U.S.-born Hispanic and Latino children grew faster.
On the whole, rural Hispanic and Latino populations have grown across all regions of the U.S. — with the fastest growth occurring in the Northeast and Midwest (below). While growing Hispanic and Latino populations are a dynamic facet of rural America, the regional and community contexts in which Hispanic and Latino people live have important implications.
Like Black and Native populations, there are some rural areas with large Hispanic and Latino populations with deep historical roots in the community. In other parts of the country, Hispanic and Latino people are recent newcomers, where the share of local Hispanic and Latino populations are small but growing. Recognizing these differences in community context is critical to designing effective policies and programs, because something that works in one context may not work in another.
![]()
The Native population in rural America
Summary of data takeaways:
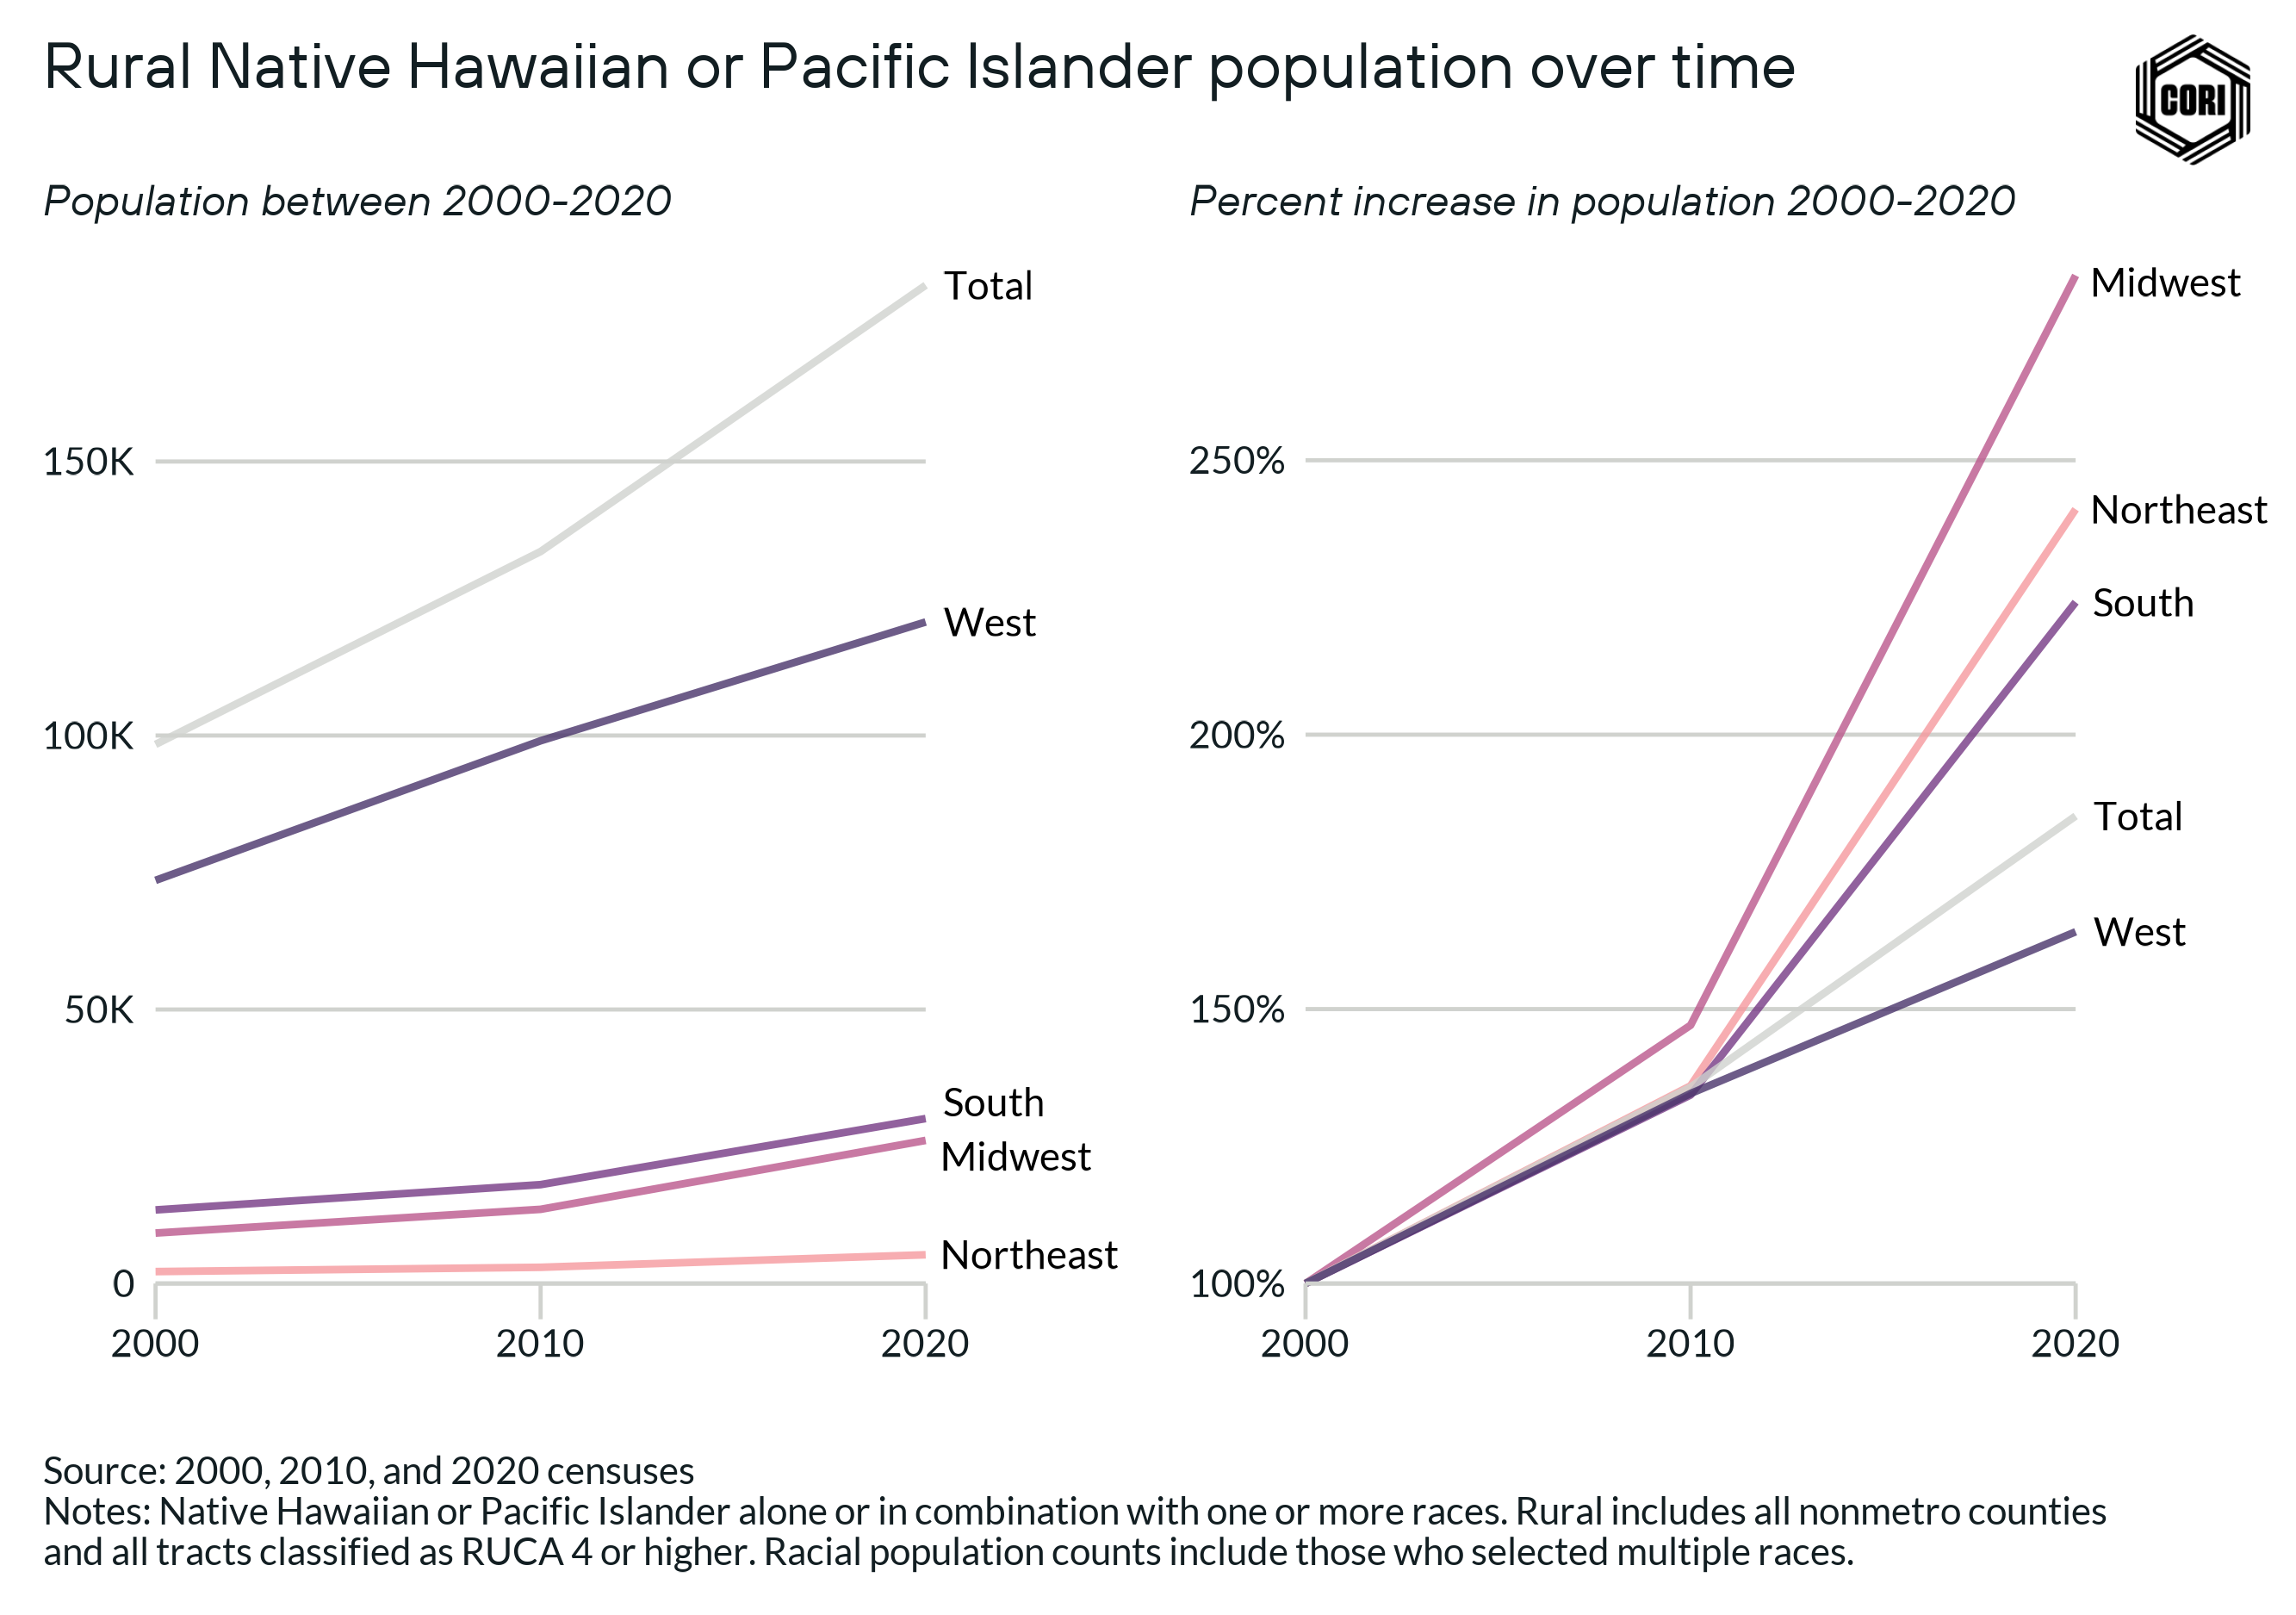
- There are 2.7 million Native people — referring to those who identify as Native American, Alaska Native, and Native Hawaiian in the census — living in rural areas across the country, accounting for 4.9% of rural people.
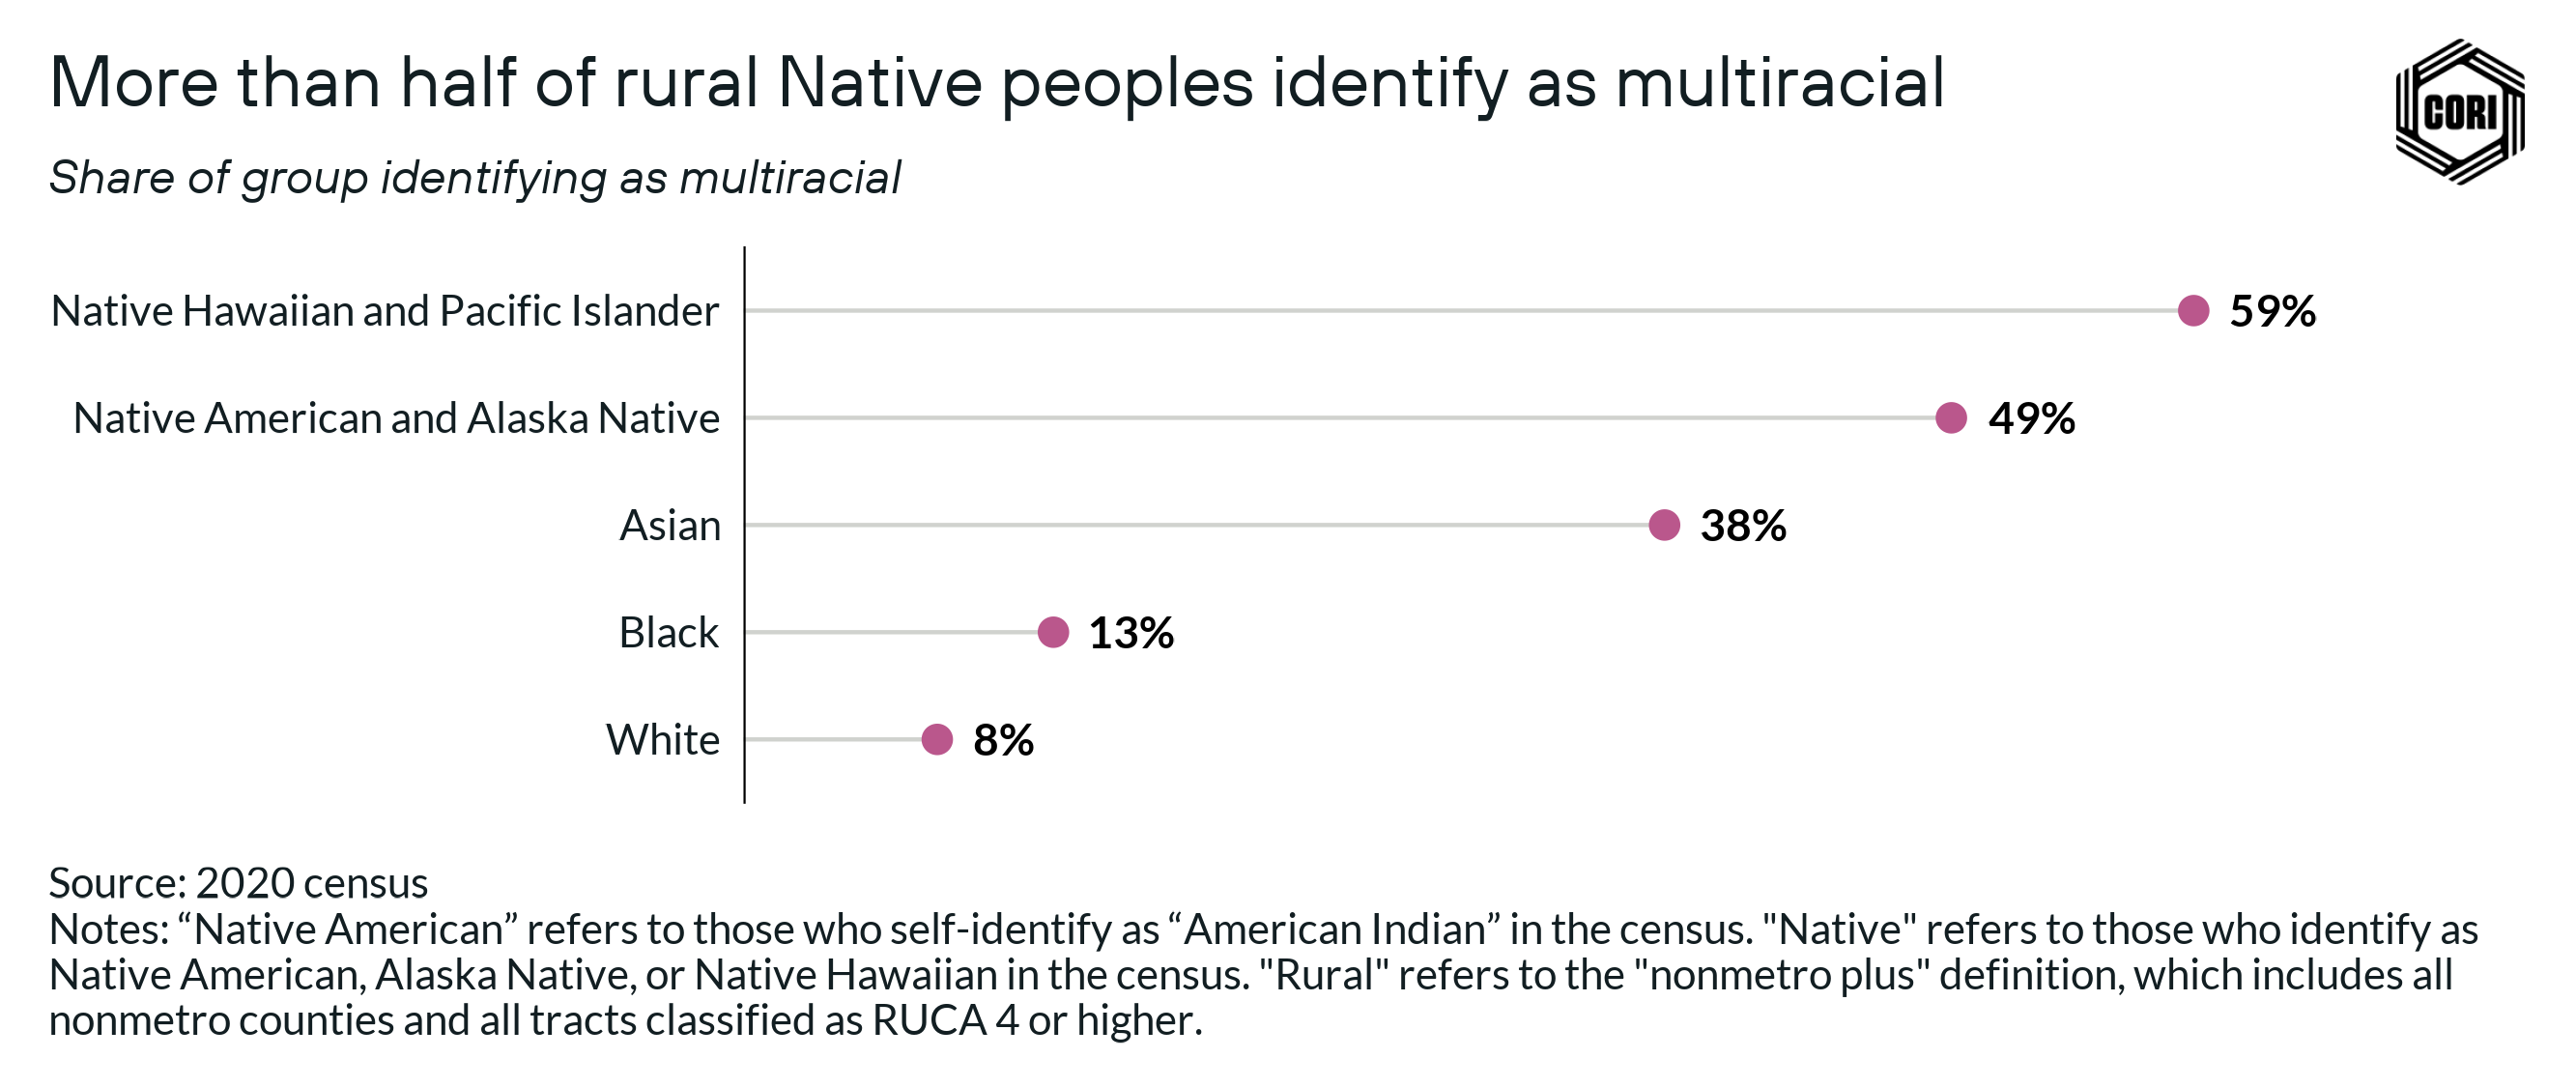
- In 2020, almost 56% of rural Native Americans and Alaska Natives, and 63% of the rural Native Hawaiian and Pacific Islander population reported more than one race, compared to just 14% of the rural Black population and 11% of the rural white population.
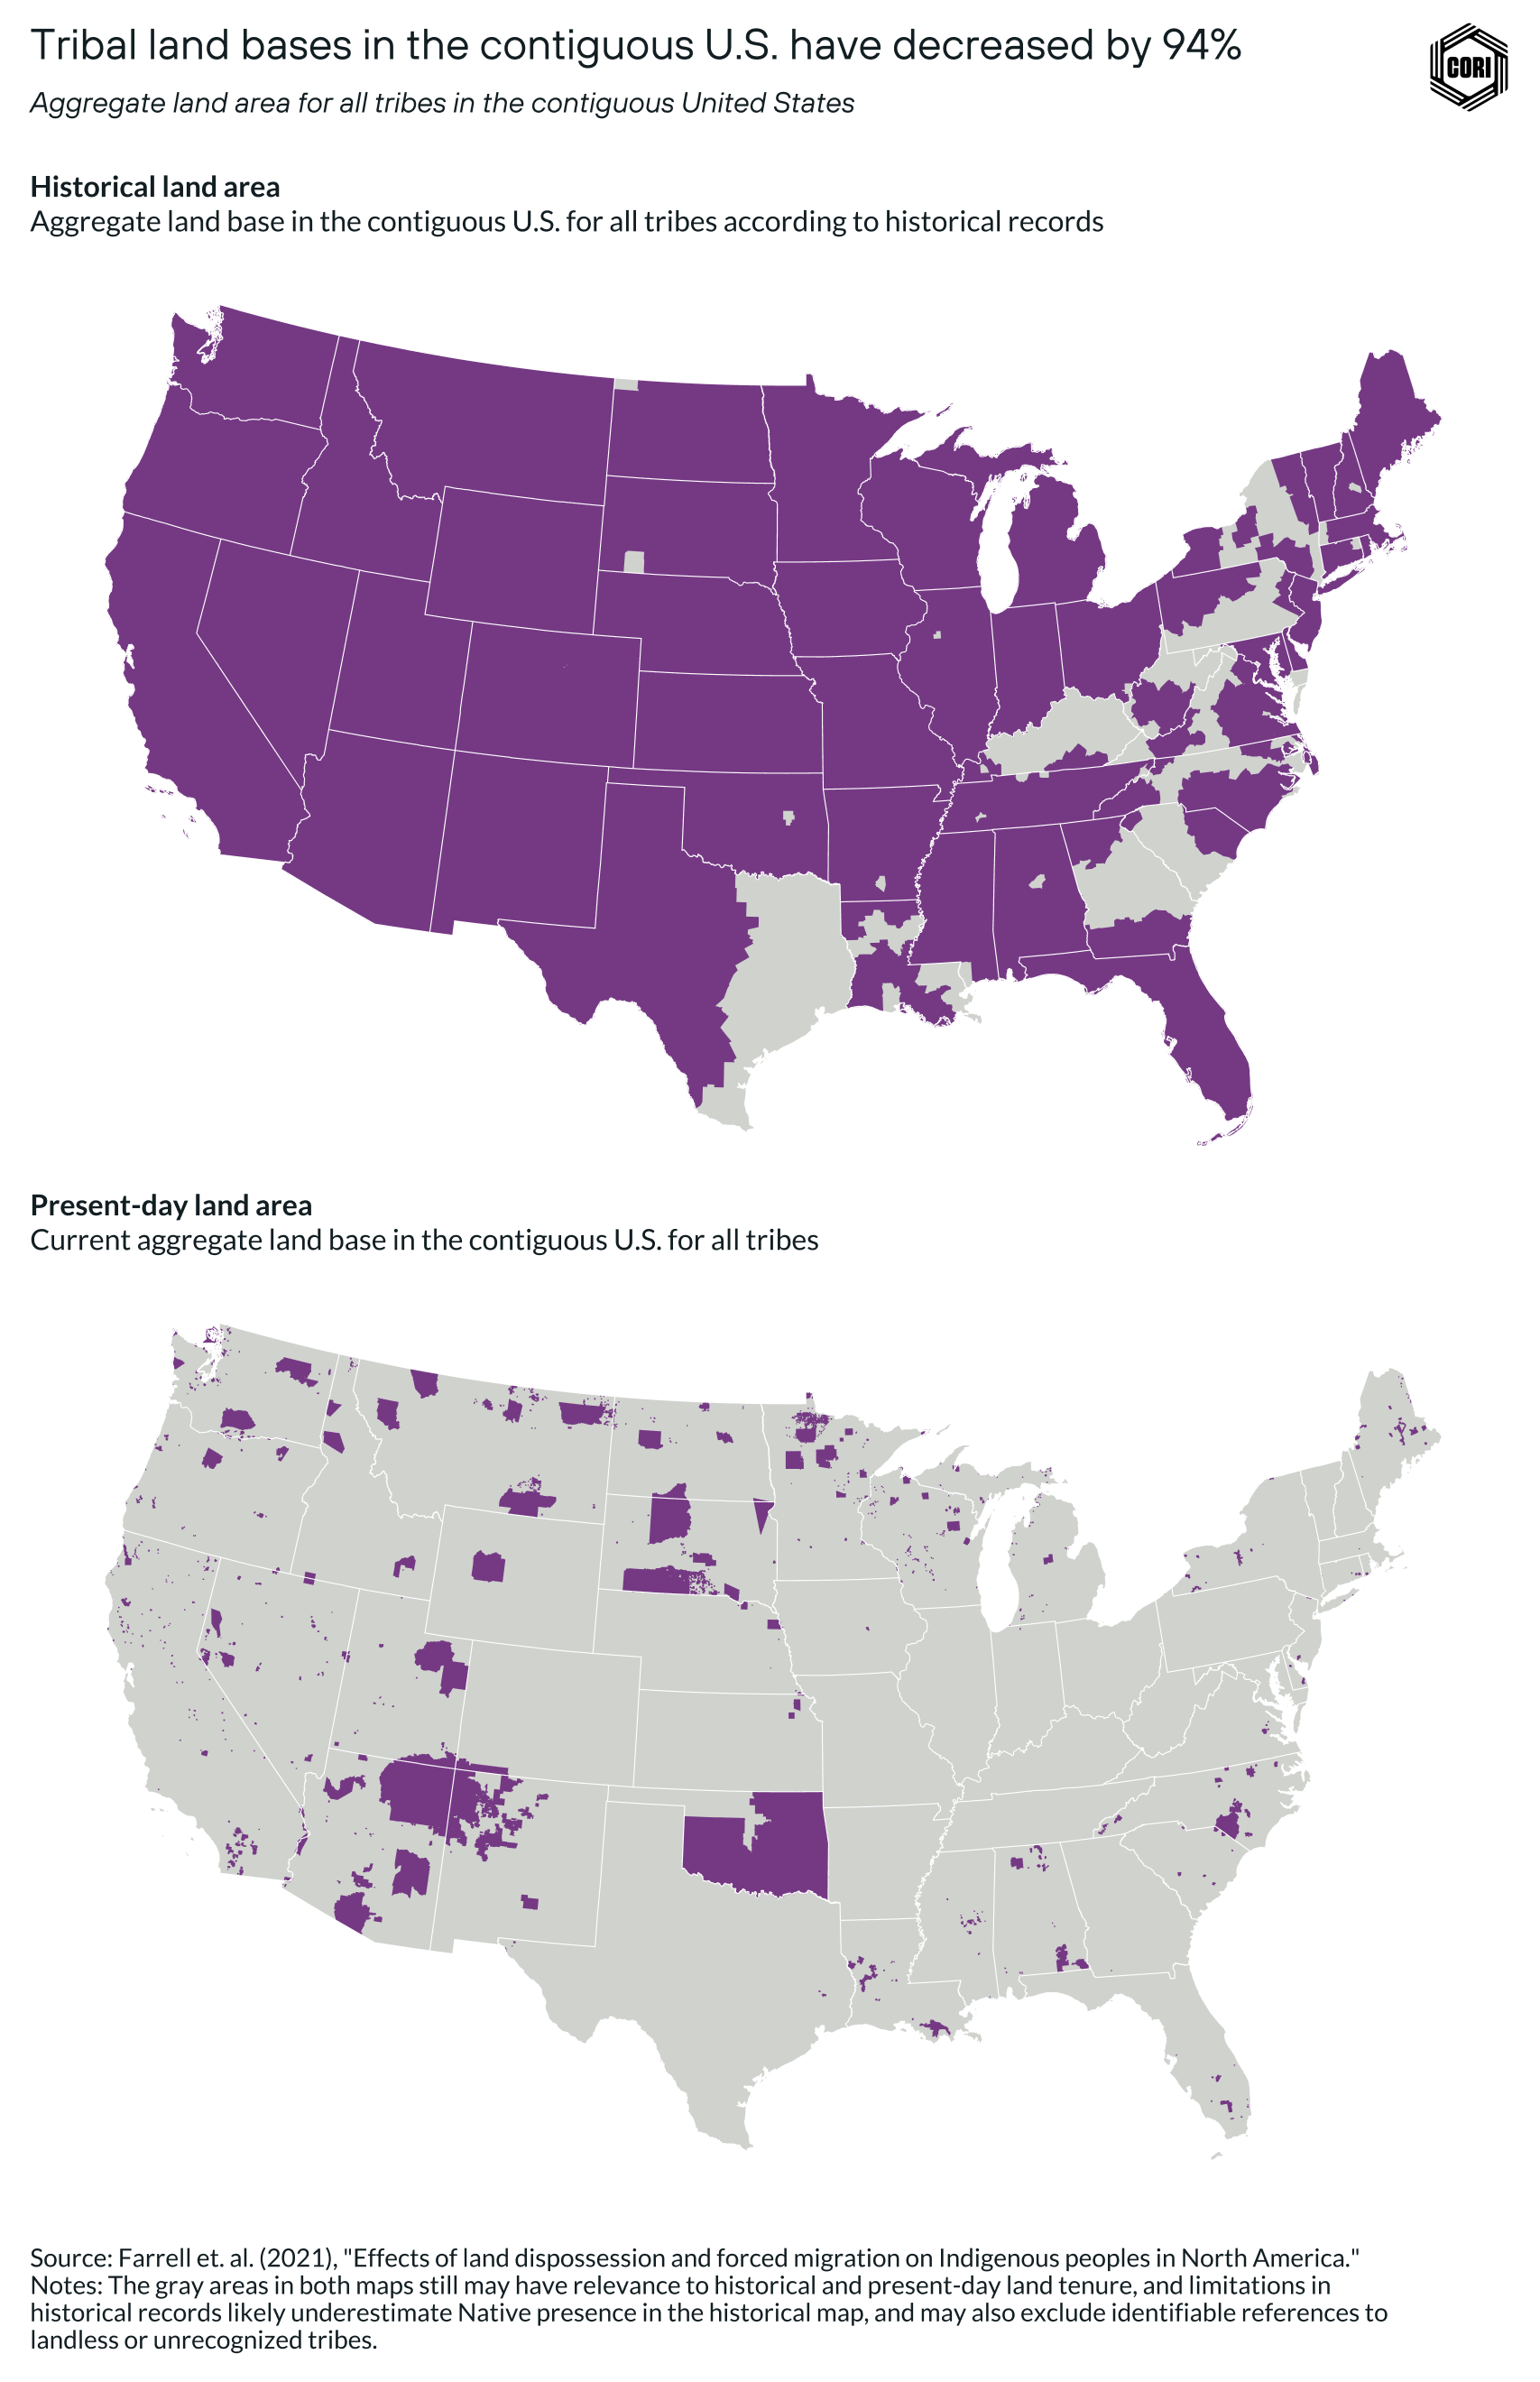
- Prior to colonization, there is historic documentation of native peoples on over 2.7 million square miles within what is now the contiguous U.S. Today, however, there is only formally recognized presence on about 165,000 square miles of land, meaning that the tribal land base decreased by about 94%.
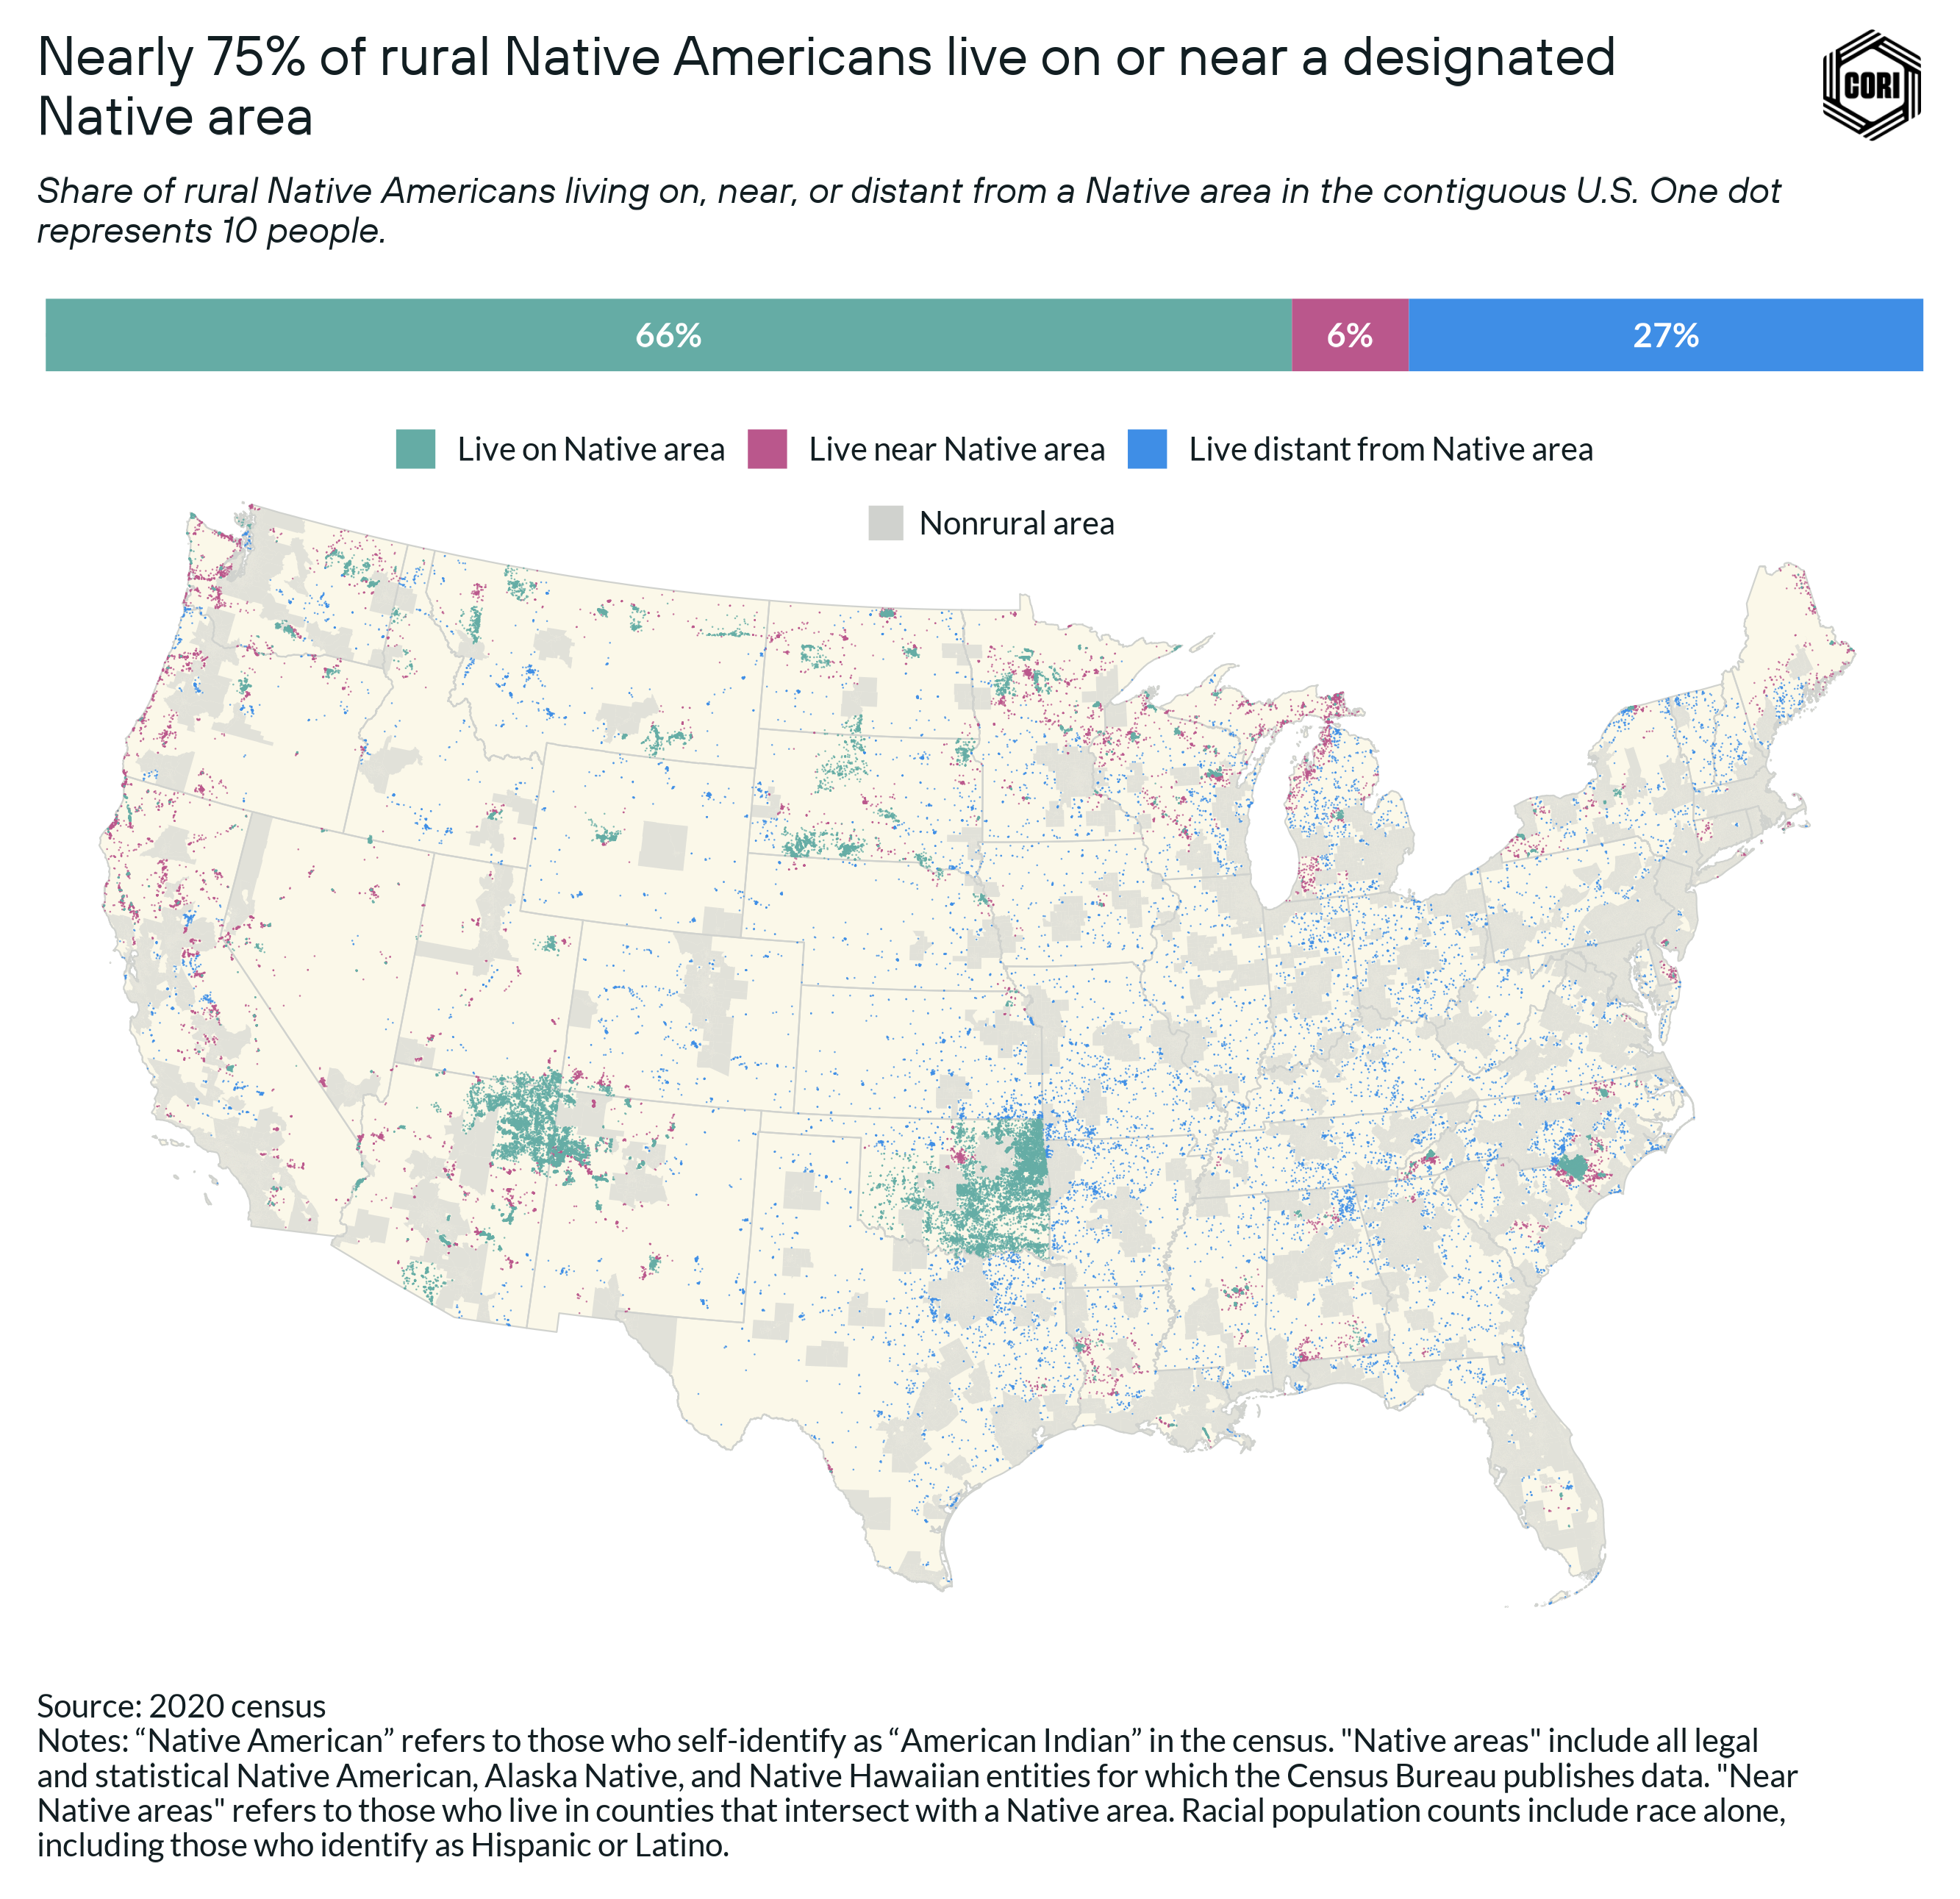
- Almost 75% of rural Native Americans (alone) and nearly 85% of rural Alaska Natives (alone) live on or near a designated tribal area, while policy and bureaucratic barriers have limited access to tribal areas for rural Native Hawaiians.
- Changes in how the census allows people to report their race has contributed to a 175% increase in the rural Native American and Alaska Native population reported by the census since 1990.
Defining Native peoples in our analysis
We use the term “Native” when we are referring to the indigenous peoples who self-identify as “American Indian or Alaska Native” or as “Native Hawaiian.” We will clarify if we are specifically referring to American Indians, Alaska Natives, or Native Hawaiians. The data we use refers to those who are Native and not Hispanic or Latino.
We use the term “Native American” when we are referring to those who self-identify as “American Indian” in the census.
Given that the census reports Native populations based solely on how people self-identify, populations include both those people who are citizens of sovereign tribal nations with nation-to nation relationships with the federal government, as well as individuals who are not tribal citizens but identify as Native.
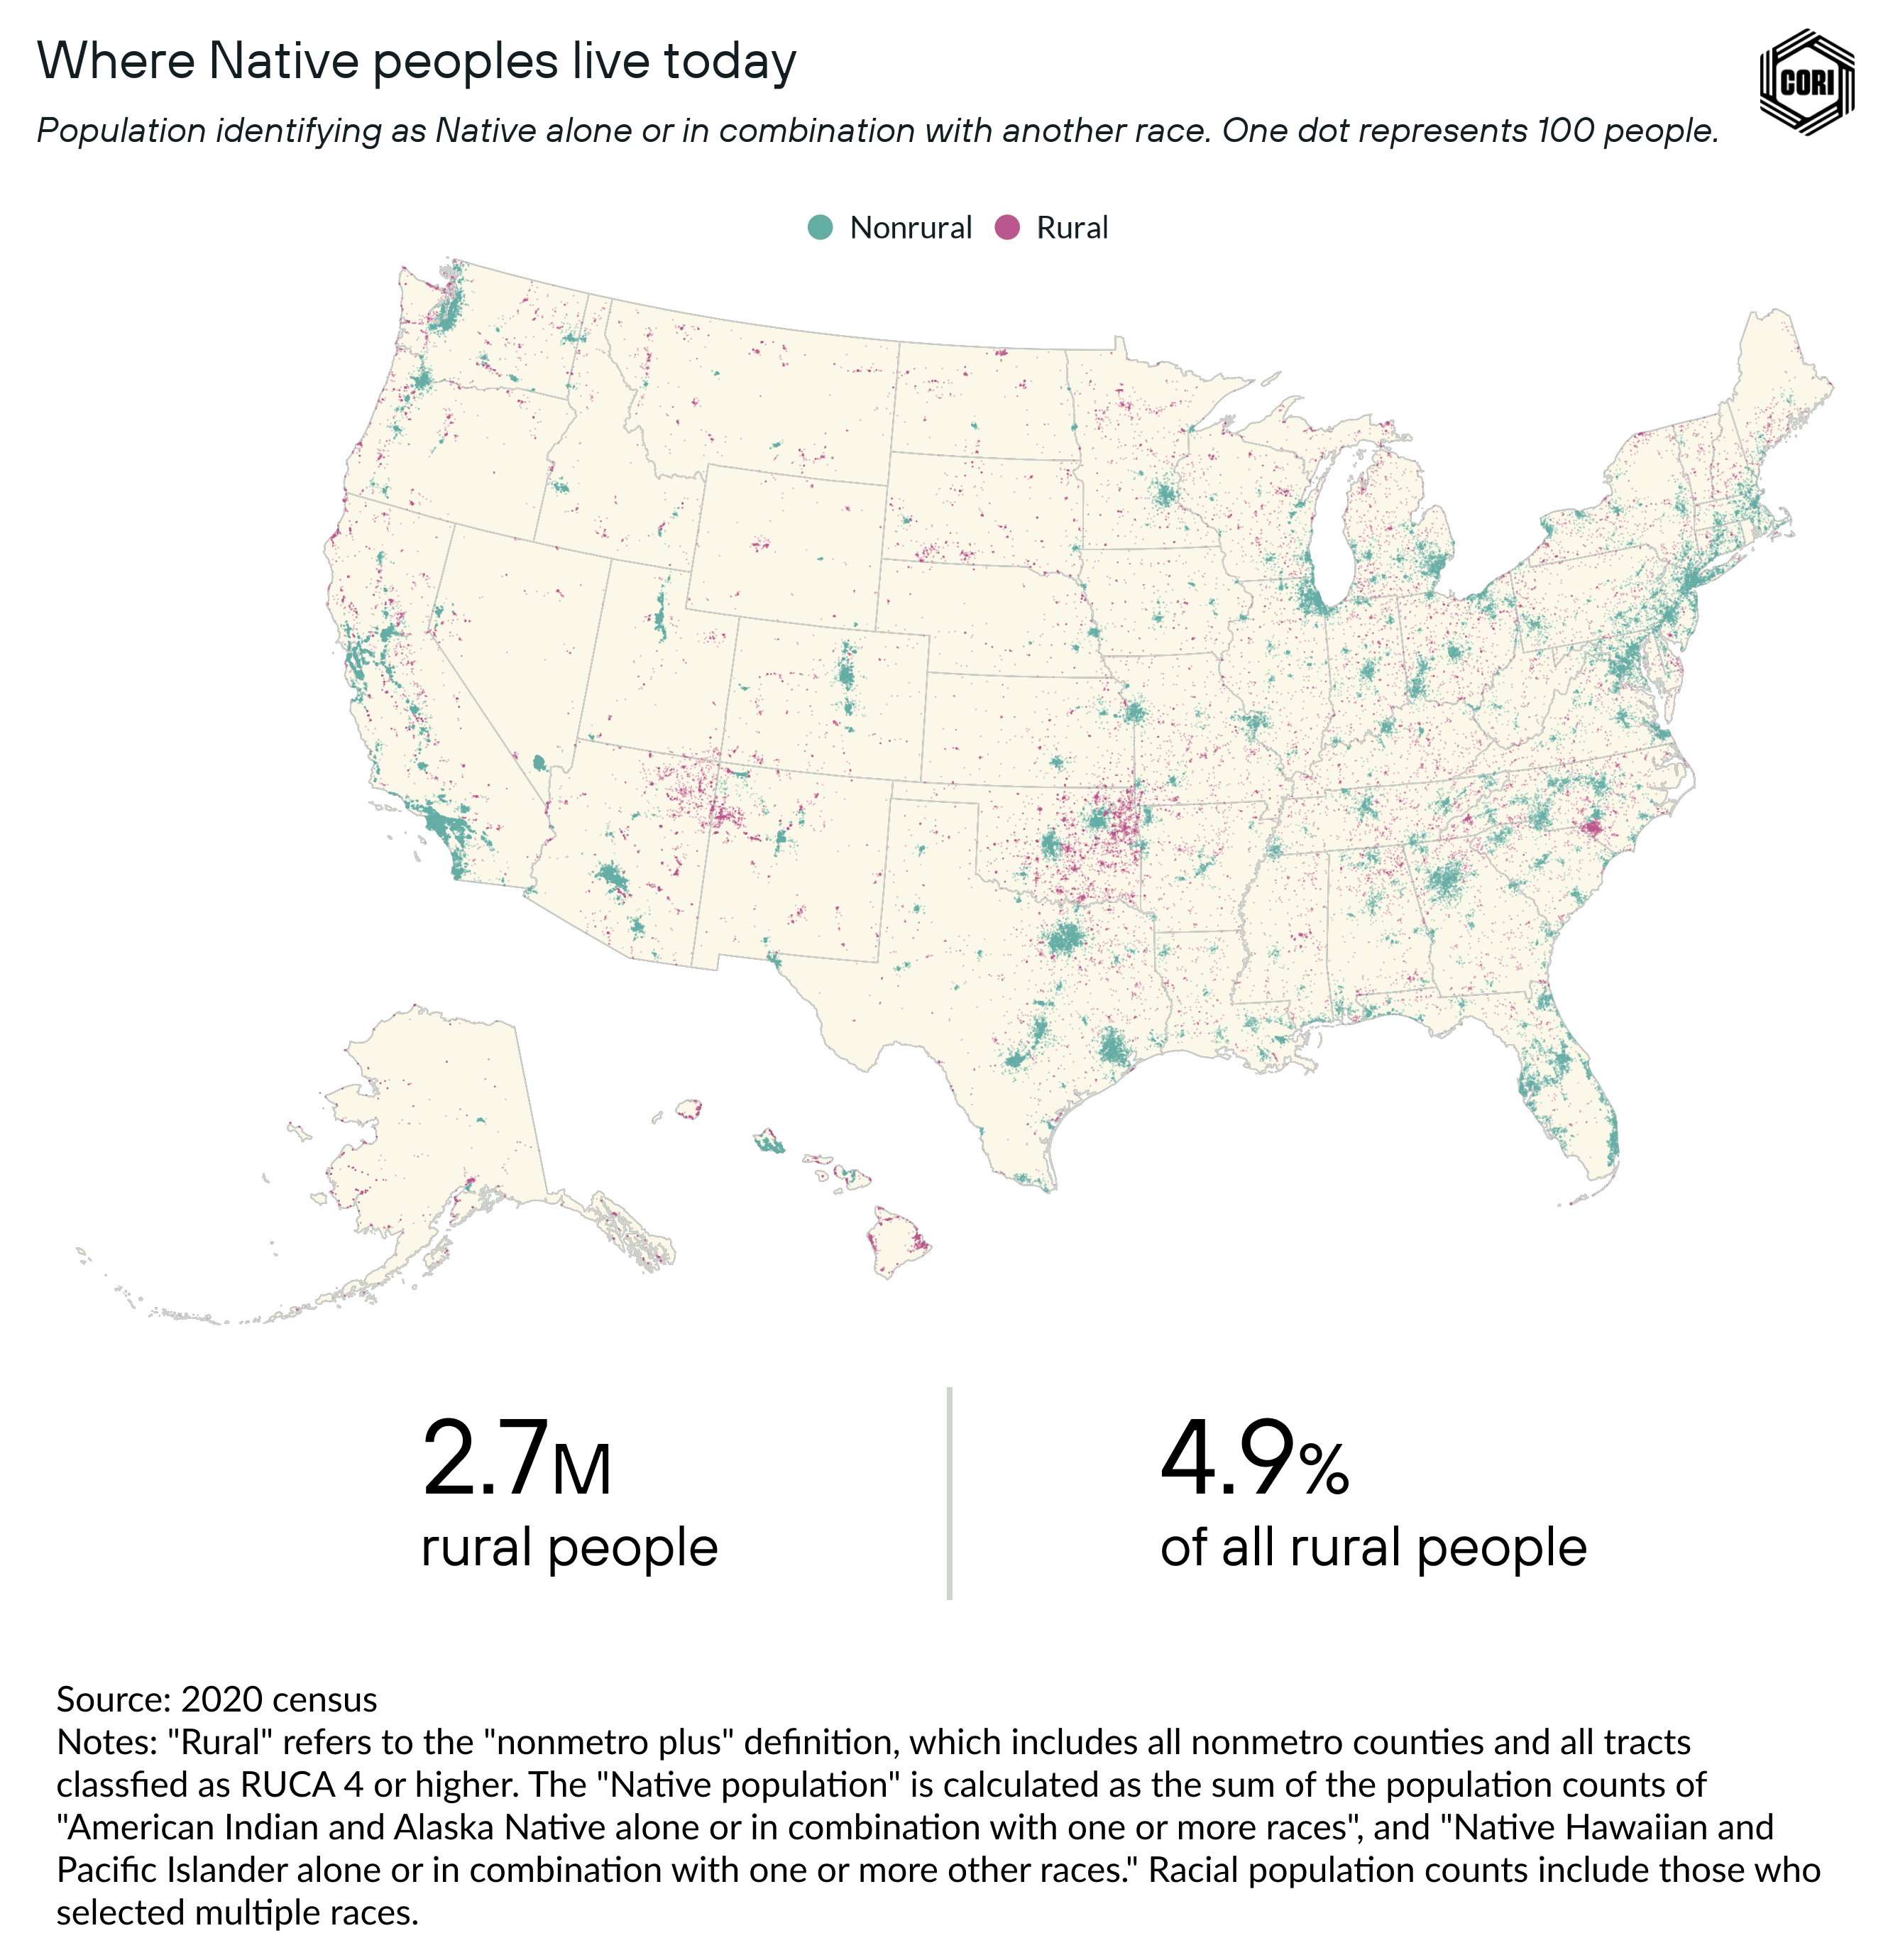
There are 2.7 million Native people — referring to those who identify as Native American, Alaska Native, and Native Hawaiian in the census — living in rural areas across the country, accounting for 4.9% of rural people (Figure 17). Many are part of the 574 federally recognized sovereign native nations across 35 states, each with its own nation-to-nation relationship with the U.S. government.
As of 2020, 13 states had created their own process of recognizing tribes that are not recognized by the federal government, although the rights that non-federally recognized tribes receive can vary greatly from state to state.
Native peoples and Native lands are inextricably tied to the history of rural places in the U.S., and existed long before the boundaries of the present-day U.S. were established. By disaggregating data on different Native populations in rural America, we are able to gain a clearer picture of the diversity of native peoples:
Native Americans
Overall, there are over 1.3 million rural people who identify as Native American (alone or in combination with another race) (2020 ACS-nonmetro). Of the 574 federally recognized Native nations, 345 are in the continental U.S. In rural America, the highest number of people identify as Cherokee, Navajo, Sioux, Chippewa, and Choctaw, although not everyone who identifies as Native American chooses to identify a tribal affiliation in the census or even has official tribal affiliation.
Alaska Natives
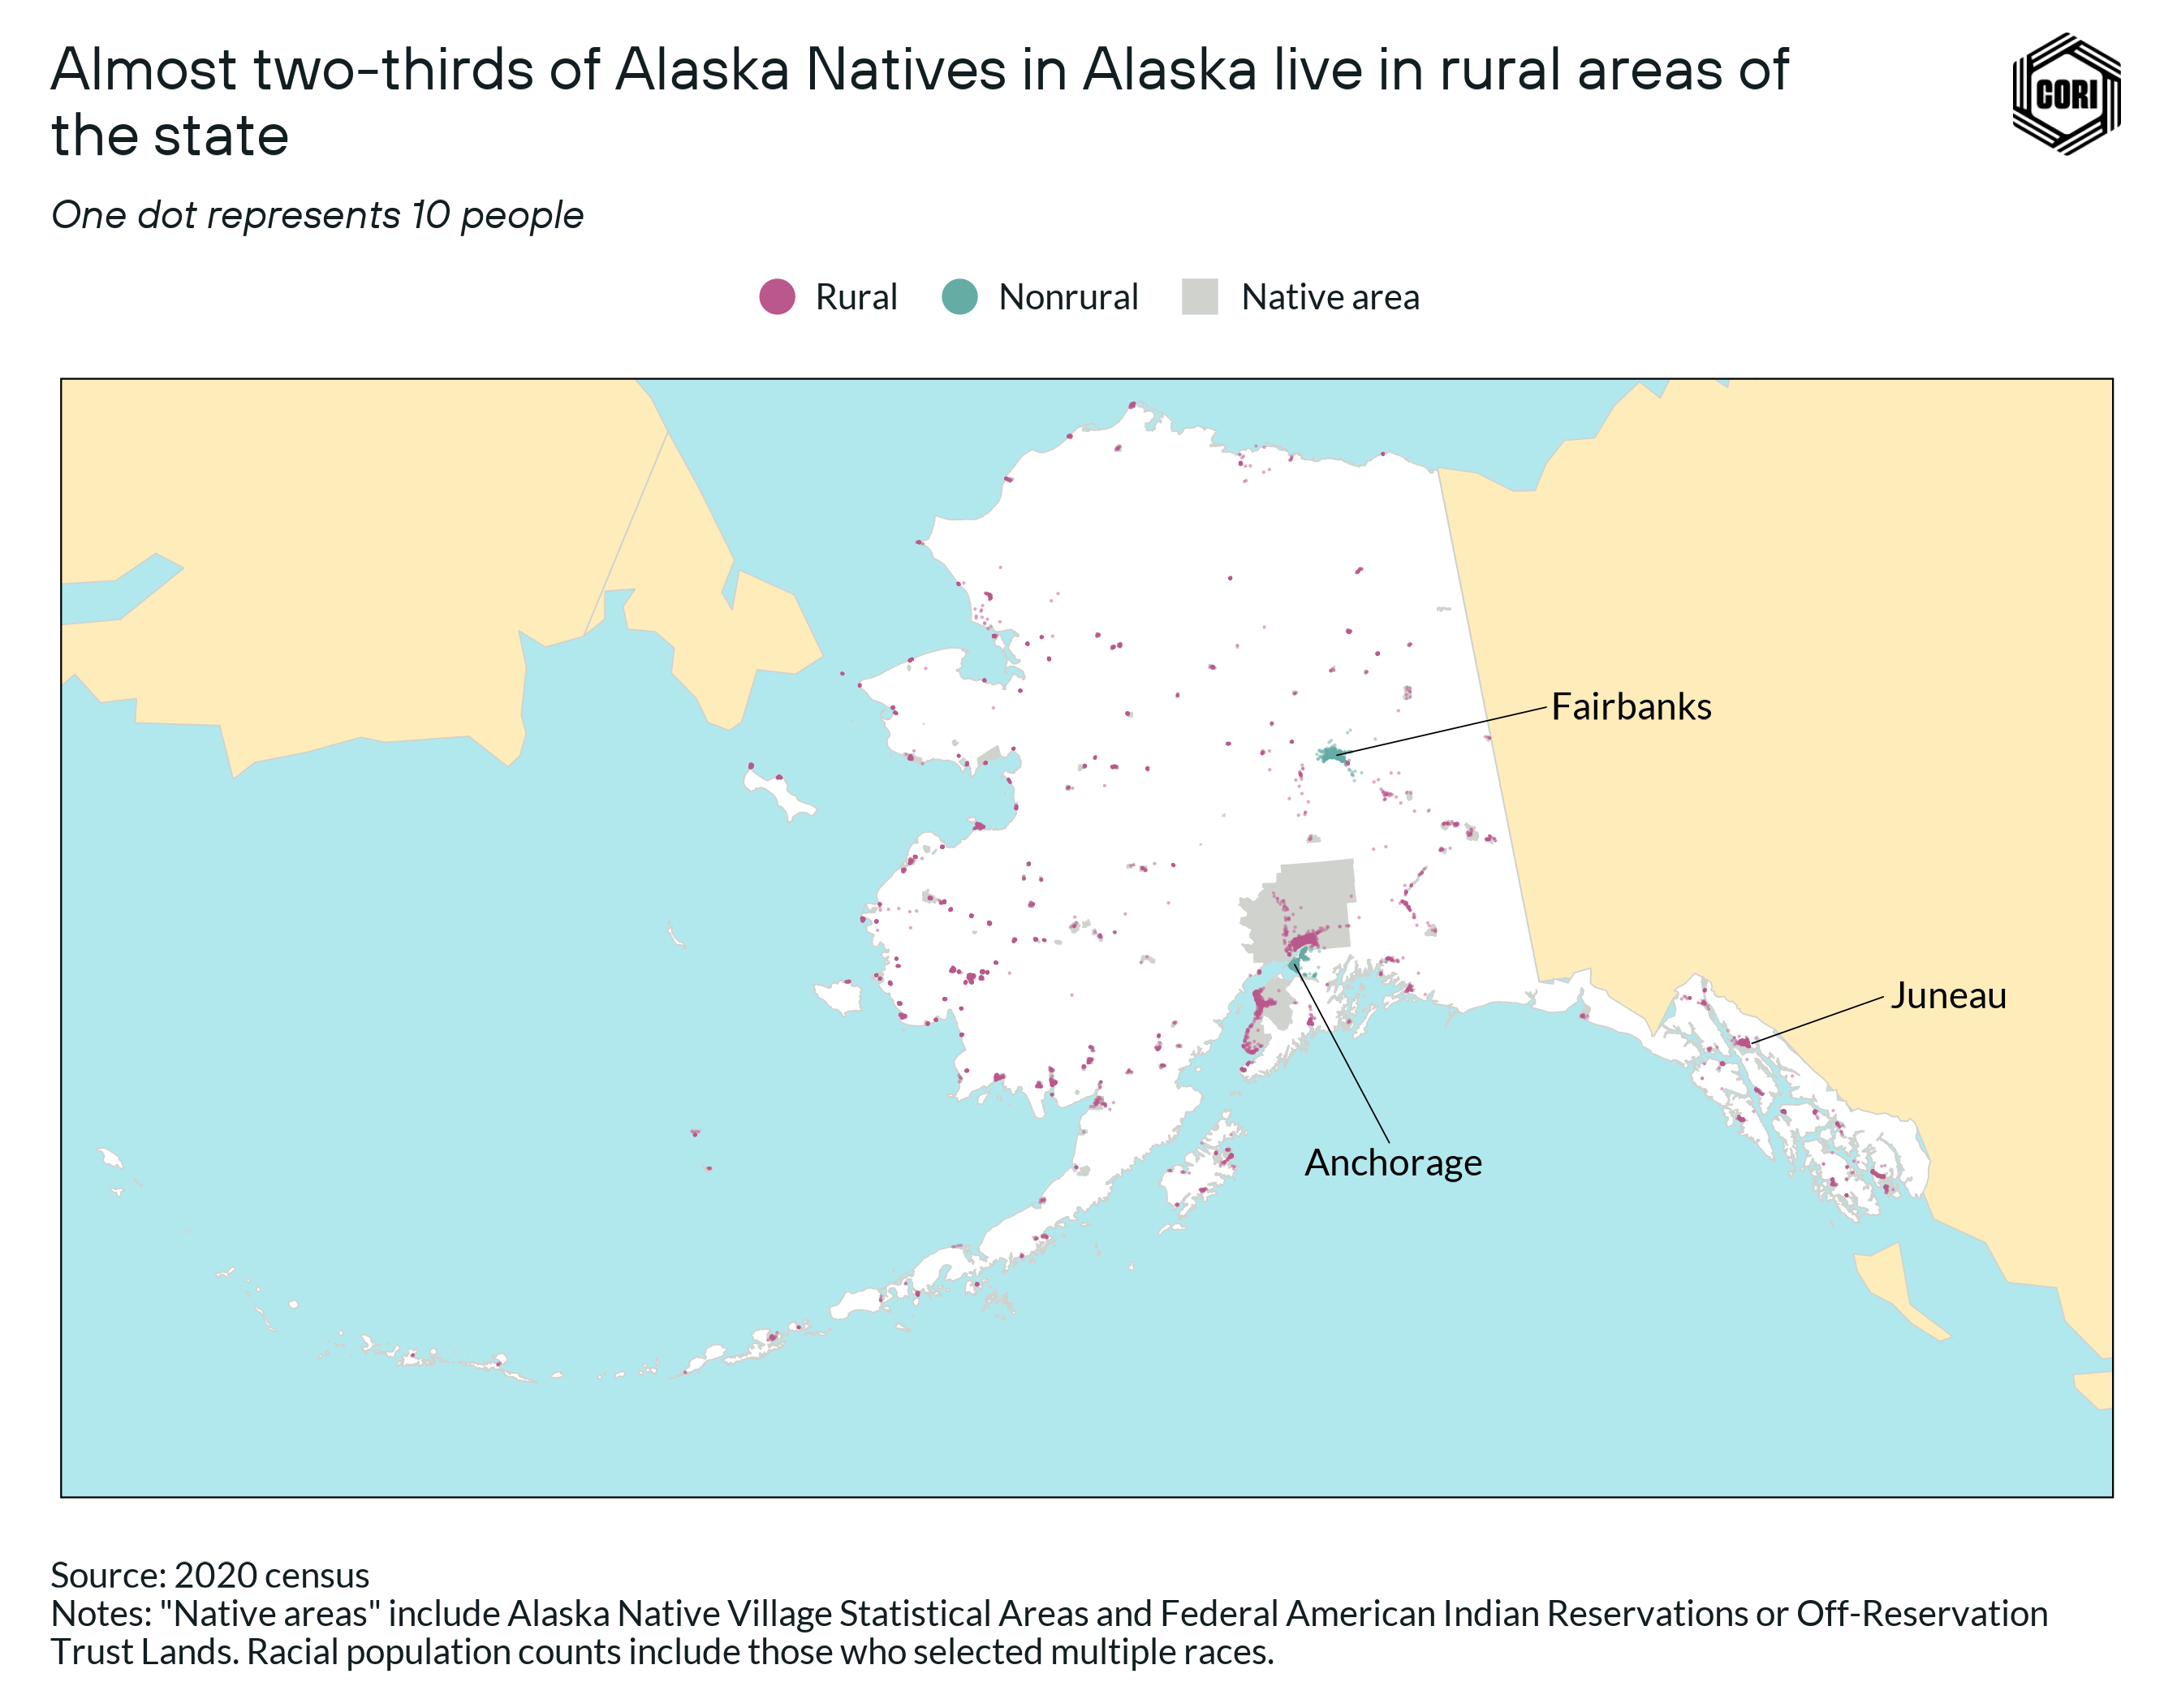
There are over 91,600 people who identify as Alaska Native in rural America (alone or in combination with another race) (2020 ACS-nonmetro). Within Alaska, nearly two-thirds of Alaska Natives live in rural areas of the state, and Alaska Natives account for about a third of Alaska’s overall rural population (ACS 2020-nonmetro).
Nearly 40% of federally recognized Native nations (229) are located in Alaska — all of which are also state-recognized, and known as Alaska Native Villages. Five nations make up the vast majority of the Alaska Native population: the Yup’ik in western Alaska; the Inupiaq, centered in northern Alaska; the Tlingit and Haida, in the southeast inland region; the Athabasacan in the interior of Alaska; and the Aleut, centered in the Aleutian Islands off of the coast (see map).
Native Hawaiians
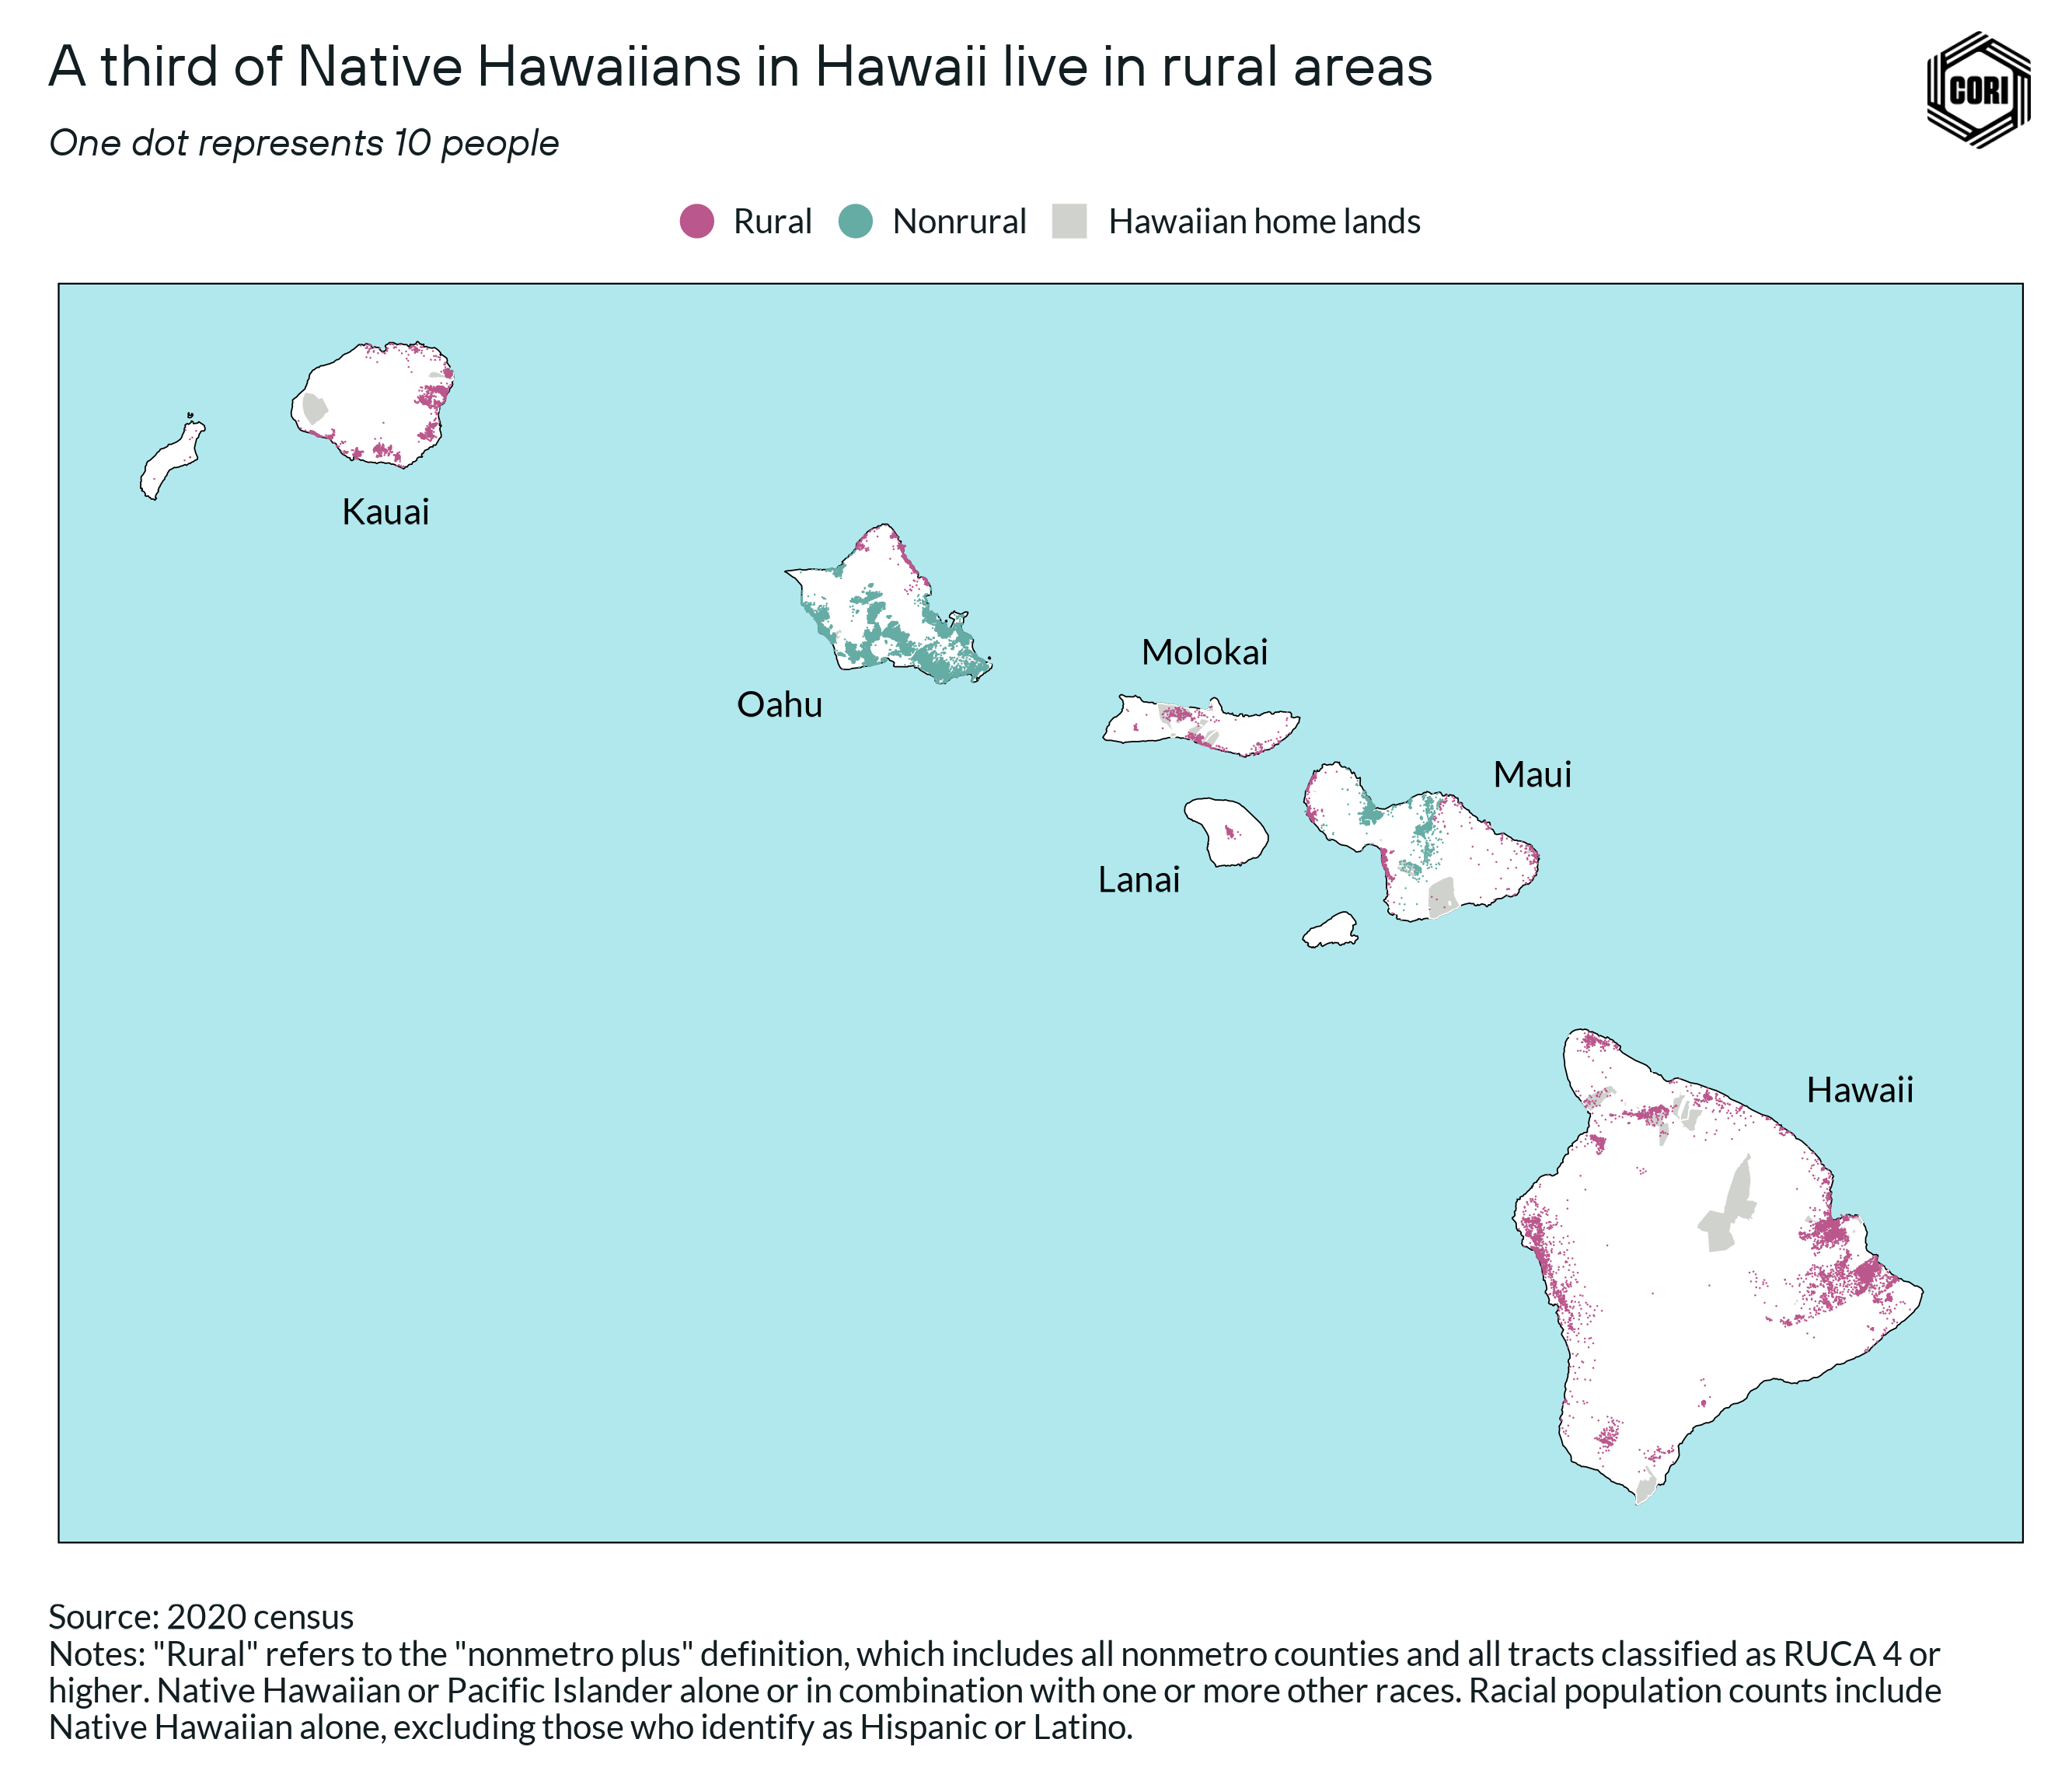
There are over 161,200 Native Hawaiians and Pacific Islanders living in rural areas across the U.S., with more than three-quarters (76%) living in rural Hawaii (nonmetro). Often, Native Hawaiians are not included in conversations about native peoples in the U.S., in part because it is a relatively small group of people, and in part because Hawaii is such a different context from the continental U.S.
Within Hawaii itself, about a third of Native Hawaiians live in rural areas scattered across the islands. The county of Hawaii — which encompasses the entire island of Hawaii — is the most diverse rural county in the country, a fact that ties into its history of imperialism, immigration, and richness of resources.
How the U.S. census defines Native groups
The way that Native people are counted by the census has shifted over time, and therefore impacted the way that programs, policies, and funds reach Native people and communities. Today, there are two census categories that represent Native peoples within the boundaries of the U.S.: “American Indian and Alaska Native” (AIAN) and “Native Hawaiian and Other Pacific Islander” (NHPI).
These categories are continually evolving, and were restructured as recently as the 2000 census. Alaska Natives were not officially recognized by the census until 1980, and between 1960 and 1990, Native Hawaiians were grouped under the “Asian or Pacific Islander” category.
While there are significant Pacific Islander communities with rich histories in rural-adjacent areas — like the Marshallese in Northwest Arkansas and Tongans in Euless, Texas — there are very few Pacific Islanders who actually live in rural areas across the U.S (ACS). For example, of all Pacific Islander nationalities, Marshallese live in rural areas at the highest rates, but overall only 14% (or about 5,200 people) of Pacific Islanders live in nonmetro counties.
For the purpose of understanding groups that are native to the current U.S., we focus more directly on the Native Hawaiian population. While generally grouped as Native peoples, Native American, Alaska Natives, and Native Hawaiians live in very different rural contexts and have unique historical experiences.
Factors that have shaped rural Native populations today
Native Americans
There is an incredibly long and rich history of Native peoples that began long before the establishment of the U.S. Prior to colonization, there is historic documentation of native peoples on over 2.7 million square miles. (below).
Today, however, there is only formally recognized presence on about 165,000 square miles of land, meaning that the tribal land base decreased by 94%. In other words, many areas that are now recognized as “Indian Country” “are far from historical lands” due to tribes being moved forcibly to, and removed forcibly from, areas across the country.
Actions taken by the U.S. federal government have played an overarching and significant role in shaping what is the geography of Native peoples today, even as the experiences of peoples and nations across the U.S. are vastly different. Prior to contact with Europeans, scholars estimate that there were between 1.5 million to 20 million indigenous people on the continent. Throughout the 1800s, the U.S. government pushed tribes off of their lands, often breaking previously signed treaties.
With the passage of several major policies including the Dawes Act of 1886, the lands they came to occupy were further subdivided and sold off to non-native people, or if a Native person chose to accept a land grant apart from their tribe, they were given citizenship. Native Americans, alongside Alaska Natives, were not granted citizenship en masse until 1924 through the Indian Citizenship Act following World War I.
While Native Americans have been subject to settler colonial policies, land seizure, forced removal, forced migration onto reservations, and forced assimilation, over the past several decades, a federal policy towards Native nations has generally focused on self-determination and self-governance, and there have been movements to push for the ability to buy back land, grow access to Native credit, and protect vulnerable natural resources.
Over the past 40 years, Tribal governments have expanded economic and political control over their jurisdictions and resources, growing their activity in business and the direct provision of services to tribal members. Tribal governments play a critical role in the lives of rural Native Americans. In general, federally recognized tribes are considered sovereign nations and have the right to self-governance, including the ability to form their own governments and laws. They also have the right to maintain control over their own lands, resources, and affairs. This shift has supported significant economic improvements for Native Americans over the past 30 years, although gaps continue to persist between the Native and non-Native population, as well as within and between different tribes.
Almost 75% of rural Native Americans (alone) live on or near a designated tribal area, which include reservations, trust lands, and tribal statistical areas (2020 census) (below):
- Reservations are lands that have been set aside by the federal government or states specifically for the use and occupancy of Native American tribes.
- Trust lands are lands that are held in trust by the federal government for the benefit of tribes, individuals, or other entities.
- Tribal statistical areas are geographies defined by tribes in partnership with the U.S. Census Bureau to describe the area and population served by the tribe when it does not have a reservation or off-reservation trust land.
Those who do not live on or near a designated tribal area often still live in rural communities made up of tribal members. This is compounded by the fact that, based on historical records, more than 42% of tribes completely lost their lands, and many of these tribes are based in rural areas but have no federally or state-recognized land base.
People who identify as Native American in combination with another race are significantly less likely to live near a tribal area — 27% live on or near a tribal area, compared to 73% of those who identify as Native American alone.
Alaska Natives
Alaska has the longest history of human habitation in the Americas, and at the time of first contact with Europeans in the mid-1700s, there were an estimated 80,000 people living in Alaska. Between the late 1700s and 1867, Alaska was occupied by Russia. When the territory was sold to the U.S. in 1867, 60,000 Alaska Natives lived in the area. After Americans discovered gold outside of Sitka, over 60,000 Americans moved to the territory in search of gold; and the Klondike gold rush around 1900 led to an additional 100,000 prospectors.
During this time, 1898 legislation extended the Homestead Act to apply to Alaska, meaning that white settlers were given permission to claim 160 acres of land. It was not until 1906 that Alaska Natives were given this ability to claim their own land through the Alaska Native Allotment Act. These policies disrupted the collective land ownership system that was customary across Alaska.
Other development projects, such as the construction of the Alaska Highway in the 1940s, also greatly impacted land and natural resource usage, population growth, and culture, as there was minimal consultation with indigenous groups when the decision was made to build the highway. The evolution of the tribal land tenure system was designed to address many of these challenges.
In Alaska, the tribal land tenure system is different than in the continental U.S. The passage of the Alaska Native Claims Settlement Act (ANCSA) in 1971 ended the indigenous land title system, and replaced it with corporate-style land ownership, in which twelve regional corporations owned by Alaska Native shareholders manage the usage of the land. Furthermore, Alaska Native Village Corporations were established, holding title to nearly 17 million acres of land across Alaska and managing the land for the benefit of its Native shareholders.
Today, there are more than 200 Alaska Native Villages, which are home to more than 85% of rural Native Alaskans (2020 Census) (below). While there are many criticisms of ANCSA, the act greatly impacted the social and environmental landscape of rural Native Alaskans because “where once Native people had stood on the sidelines and watched the resources being taken from their land, they were now participants and beneficiaries and they also controlled the terms of development.”
This matters because even though Alaska Natives now make up a smaller portion of the Alaskan population — 20% of the Alaskan population today, as compared to 45% in 1940 — they still maintain influence over indigenous lands, even if opinions on the impact of the model are mixed.
Native Hawaiians
Like the many Indigenous peoples living on the American mainland and in Alaska, Native Hawaiians also historically faced major impacts of colonialism and imperialism. In the late 1800s, a group aided by the U.S. Marines and diplomats overthrew the Hawaiian government and forcibly removed its Queen Lili`uokalani. The U.S. then annexed Hawaii in 1898. While Hawaii first became a U.S. state in 1959, American and European imperialists had a presence on the island since the early 1800s, in large part due to the cheap sugar that was seen as abundant.
In 1848, an event known as “The Great Mahele” disrupted the status quo system of Hawaiian land tenure — as land was divided up across the king, chiefs, government, and farmers and fishermen. Less than 1% of land was left to farmers and fishermen, and a significant amount of land was sold to foreigners, some of whom were “sugar barons.”
Between the 1850s and early 1900s, American plantation owners recruited labor from abroad — predominantly from Japan, China, Portugal, and Korea, to staff the sugar farming, and Filipinos became one of the largest recruited groups. While this snapshot offers just a small glimpse into relations between Native Hawaiians and the Americans who came to take control, it helps to explain some of the origins of diversity across the islands and the impacts on the lives of rural Native Hawaiians.
The native land tenure system of Hawaii, like that of Alaska, is quite different from that of the continental U.S. While Native American reservations are managed by the federal government, Hawaiian home lands — more than 200,000 acres of trust land set aside for Native Hawaiians under the Hawaiian Homes Commission Acts of 1920 — are managed by the state of Hawaii.
These lands are governed by Homestead Associations, which serve the same roles as tribal governments. Anyone with at least 50% Hawaiian lineage and 18 years or older is beneficiary of the land trust and is entitled to a homestead. Yet, many have faced significant challenges and barriers to accessing the land. Roughly 35,000 people live in Hawaiian homelands, with more than 28,000 Native Hawaiians currently on the waitlist.
In other words, while a third of Native Hawaiians in Hawaii live in rural areas of the state, only a fraction live in officially recognized trust lands.
Going beyond the top-line census numbers on the rural Native population
Native populations are the most likely group to be undercounted by the census. More than 80% of federal reservation lands are considered “hard to count” areas, and socio-economic factors like unemployment, language, and lack of telephone contribute to undercounting. Even when Native people are counted by the census, the way counts are reported underrepresents the population.
One reason is because Native people are much more likely to identify as more than one race. In 2020, nearly 50% of rural Native American and Alaska Natives, and nearly 60% of the rural Native Hawaiian and Pacific Islander population reported more than one race, compared to less than 13% of the rural Black population and less than 8% of the rural white population (below).
This means that over 1.2 million people identifying as Native American and Alaska Native are unrecognized when using single-race data (2020 census-nonmetro plus).
Because single-race data is the more commonly used metric in the media and by the federal government, those who select multiple races — such as Native American and Black — are placed in the “Two or more races” category, and may therefore seem invisible. Misleading statistics can mean that Native communities are skipped over when it comes to distributing funding from federal agencies and private foundations.
An additional issue with census data is that it is based on self-reported racial identity and does not reflect the actual population of enrolled tribal members. Recently, federal agencies have started to move away from using census data for allocating federal pandemic stimulus funds, and instead are using tribal enrollment data which provide a complete and accurate count of tribal populations.
Growth trends of rural Native populations
Over the past three decades, the rural Native population reported by the census has grown substantially nationally and across every region of the country (below).
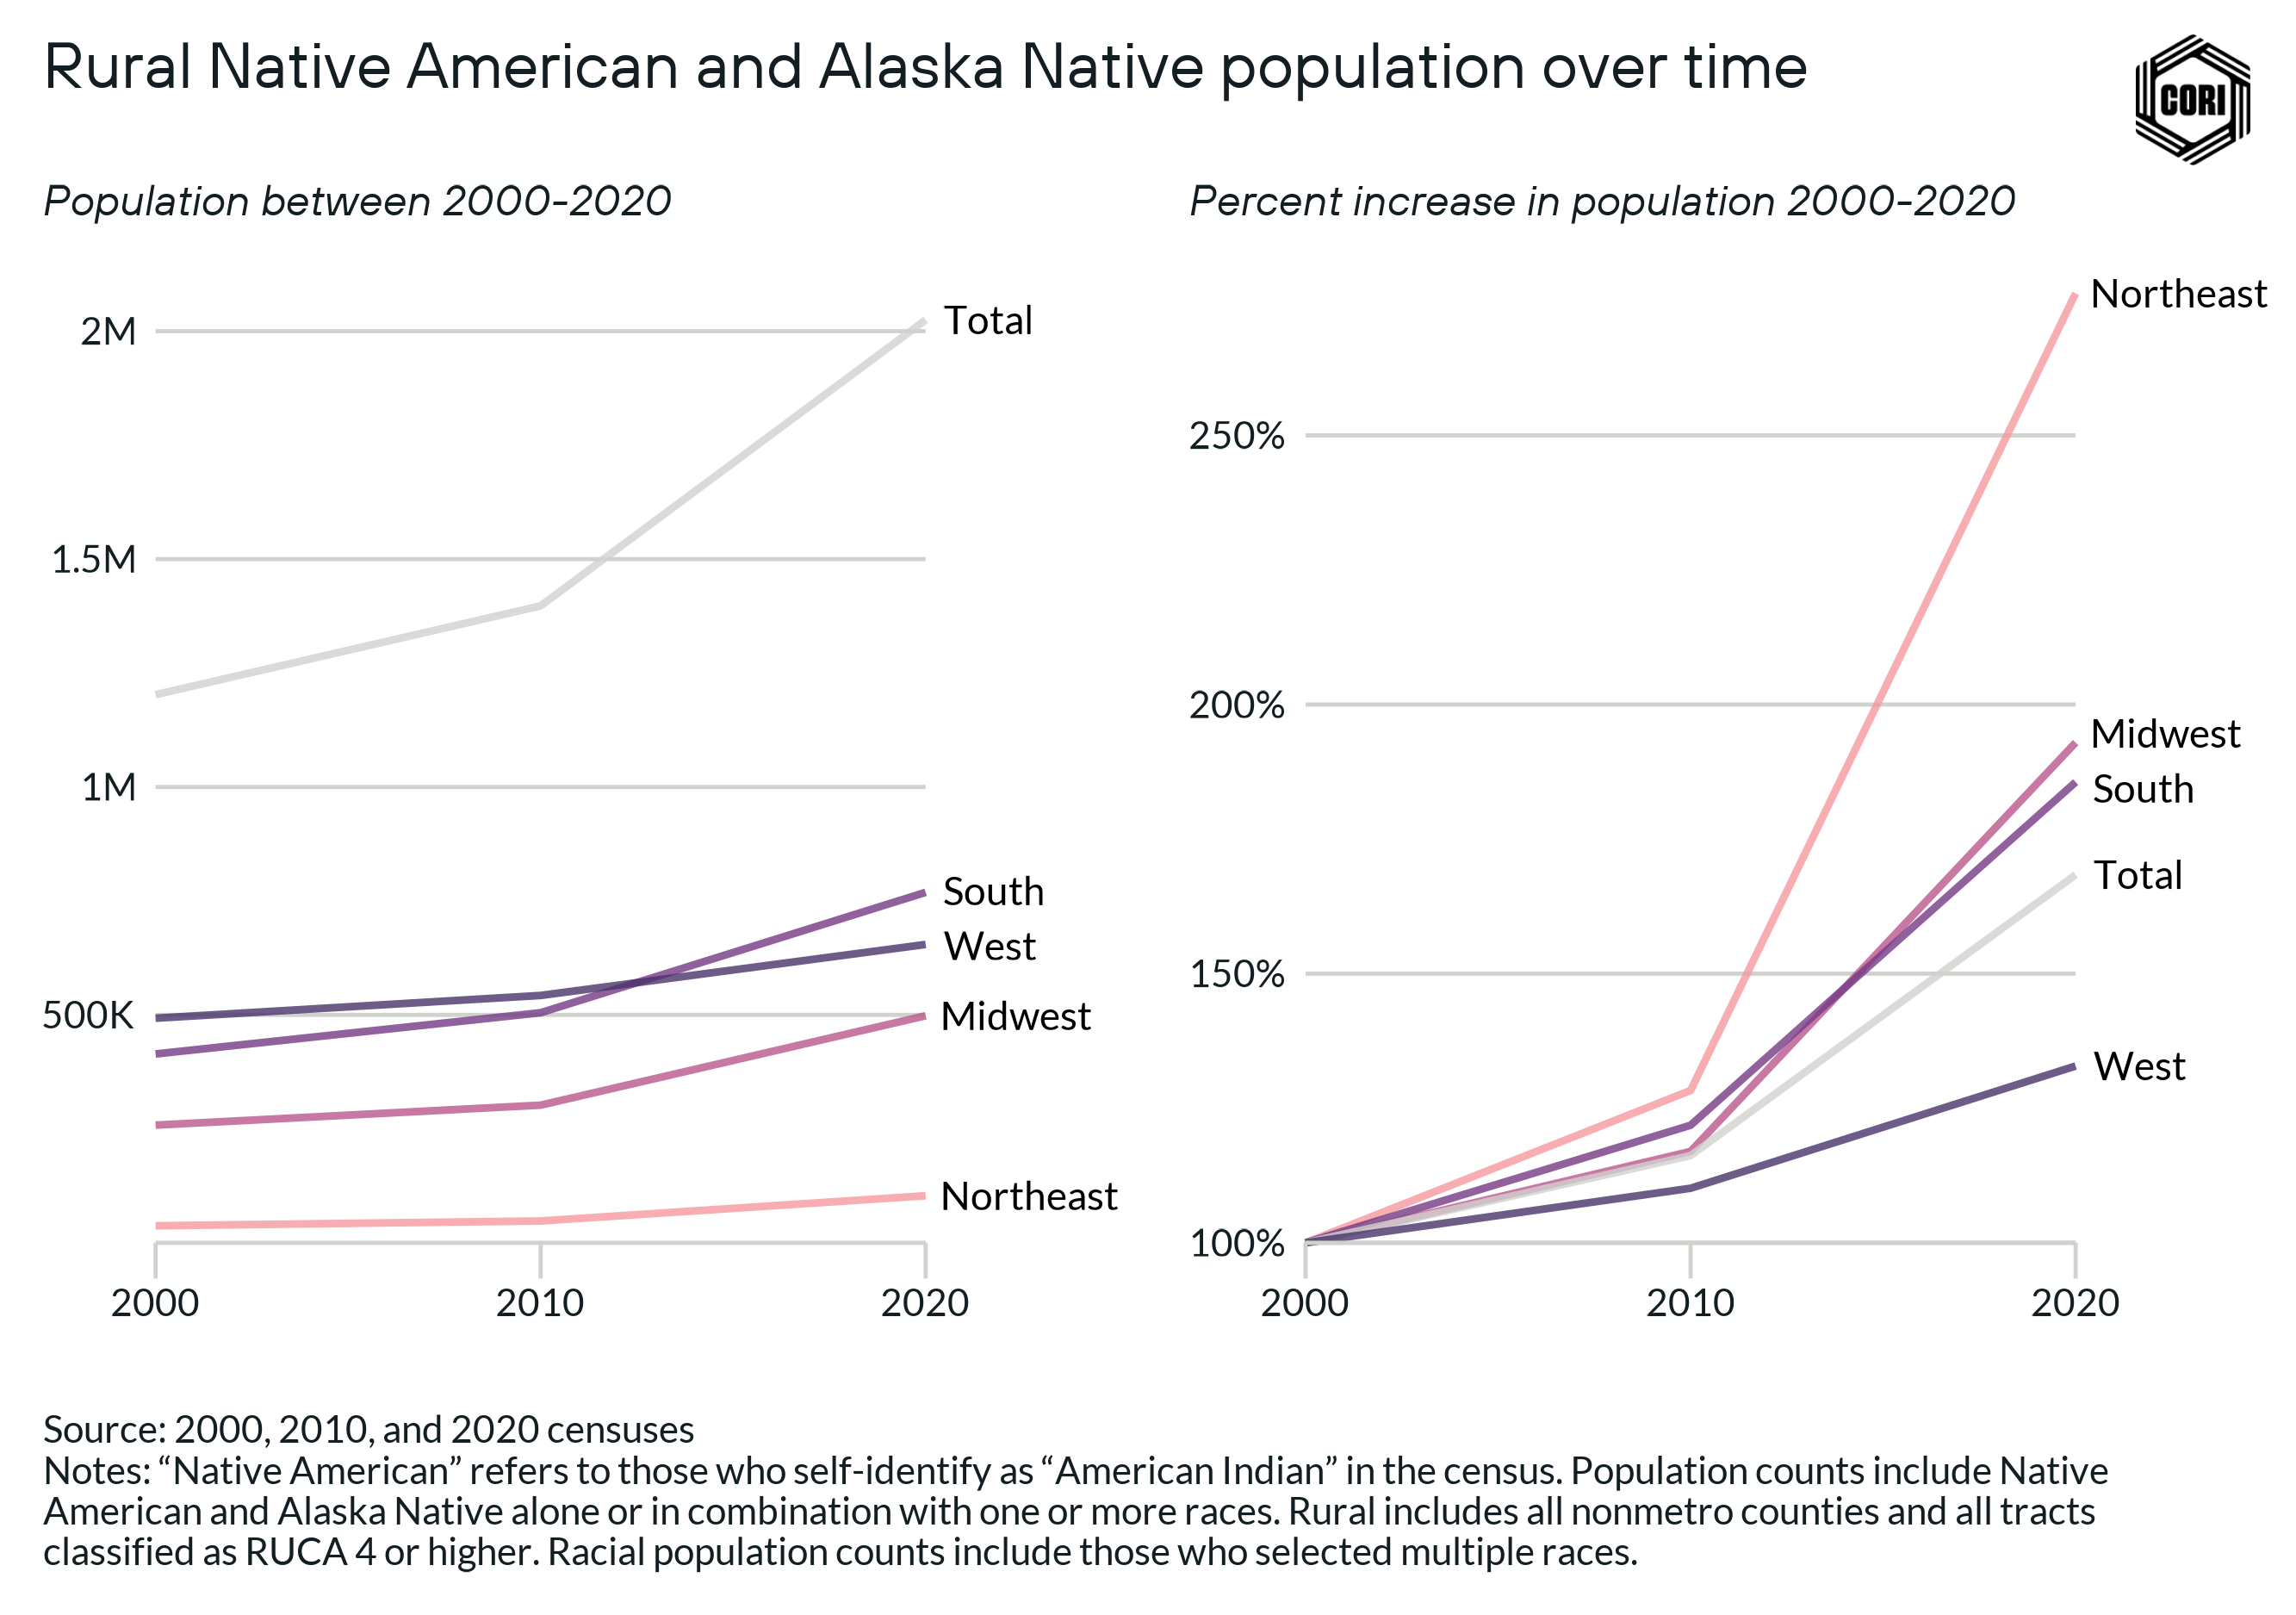
While an element of this growth can be attributed to Hispanic and Latino immigrants identifying as Native American, it is also driven in part by the way the census counts race, and the significant growth in the population identifying as more than one race. In 1990, the census did not allow people to select more than one race, and only reported roughly 800,000 Native Americans and Alaska Natives living in rural America. By 2020, that population has grown to over 2 million (below).
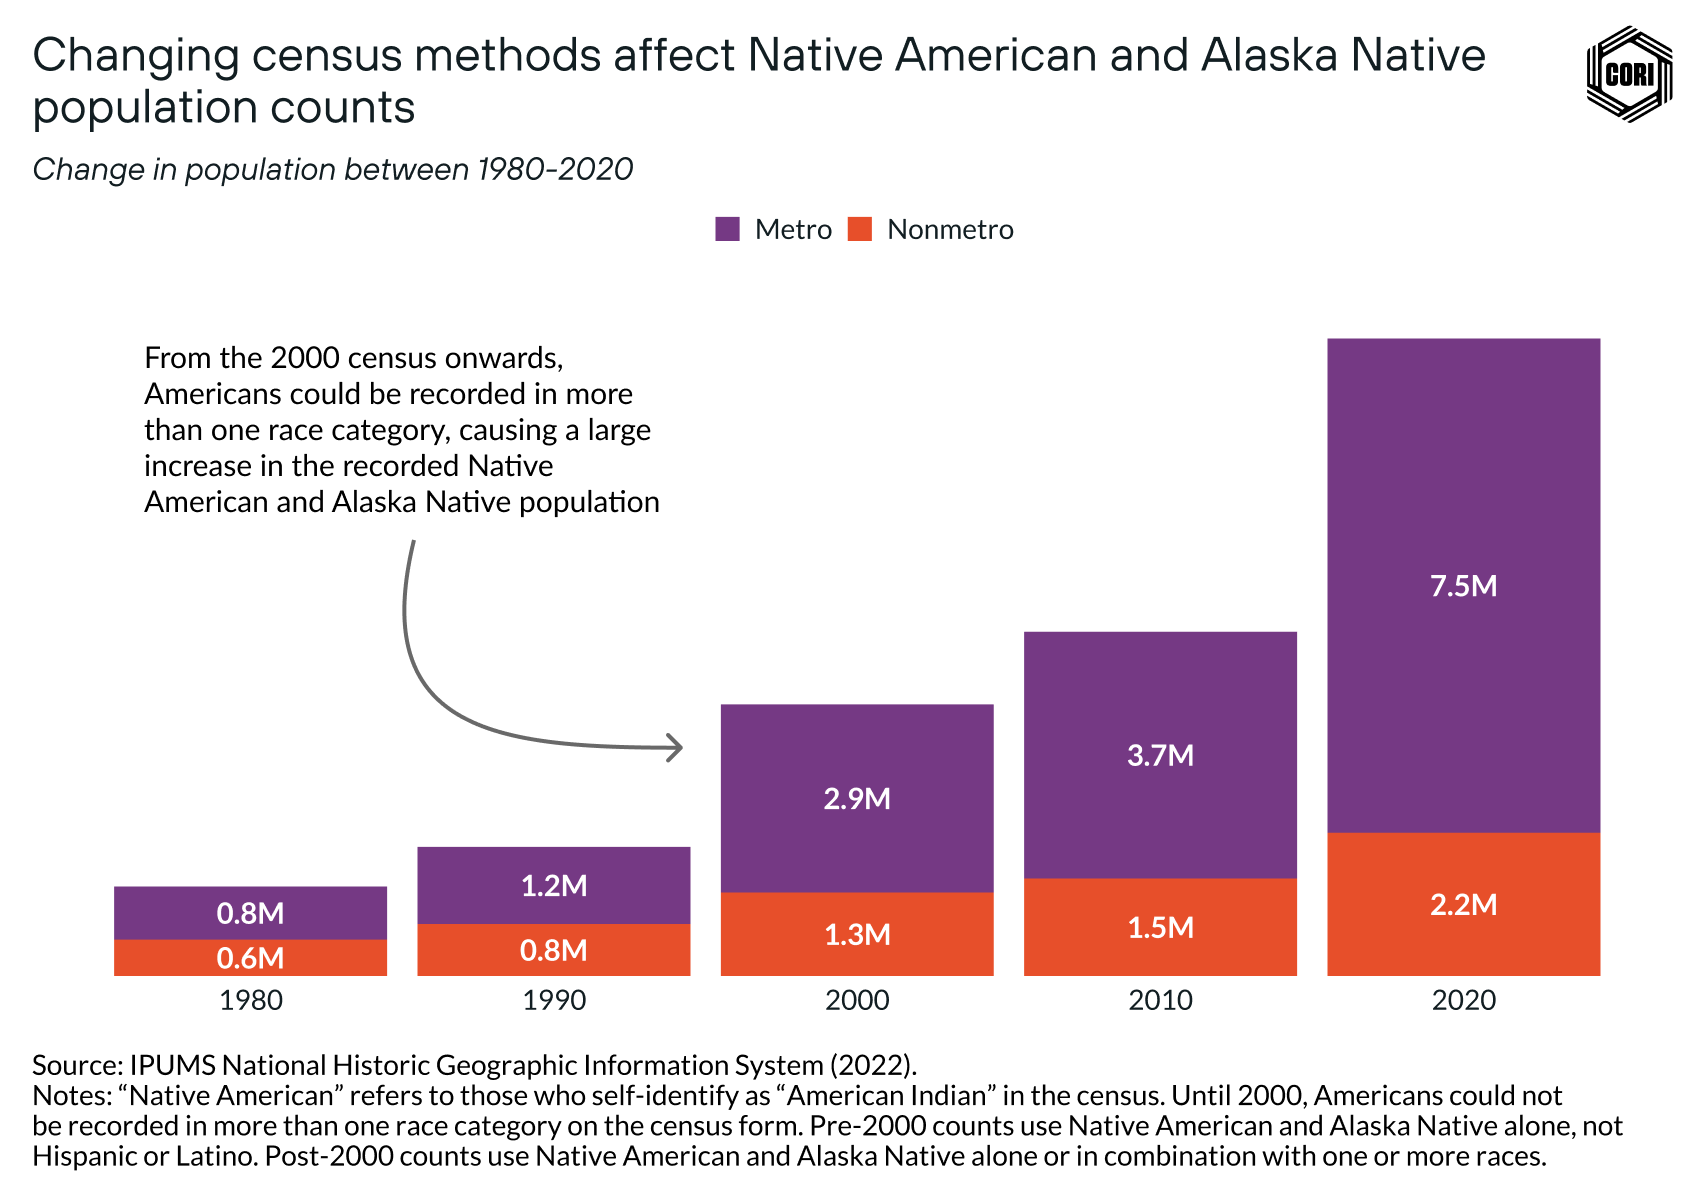
This fact is a sobering reminder of the extent to which Native people have been undercounted in the past, and continue to be undercounted today. This history of undercounting has led to Native people being overlooked and made invisible in rural America. It has also had real financial impact on tribal governments and communities that have received lower levels of federal funding than should have been paid to them.
While 2020 census data is reporting Native populations who were not counted previously, the data we have today can be misleading. First, census data only represents the population that self-identifies as Native, and not necessarily who has tribal membership. Additionally, it is critical to understand the relationship between Native lands and Native populations. Data on populations living in Native areas can also misrepresent the population if not put into the appropriate context, as many Native people live nearby, but not on Native lands, while others live far from legally or statistically defined Native areas.
While data can be a helpful tool for understanding Native populations in rural America today, data users should be very cautious about drawing conclusions from data, and need to understand the history that has shaped the way Native people have been represented in census data.
![]()
The Asian population in rural America
Summary of data takeaways:
- Asian Americans and Asian immigrants represent one of the smallest rural populations: 934,000 people, which accounts for only 1.7% of rural people
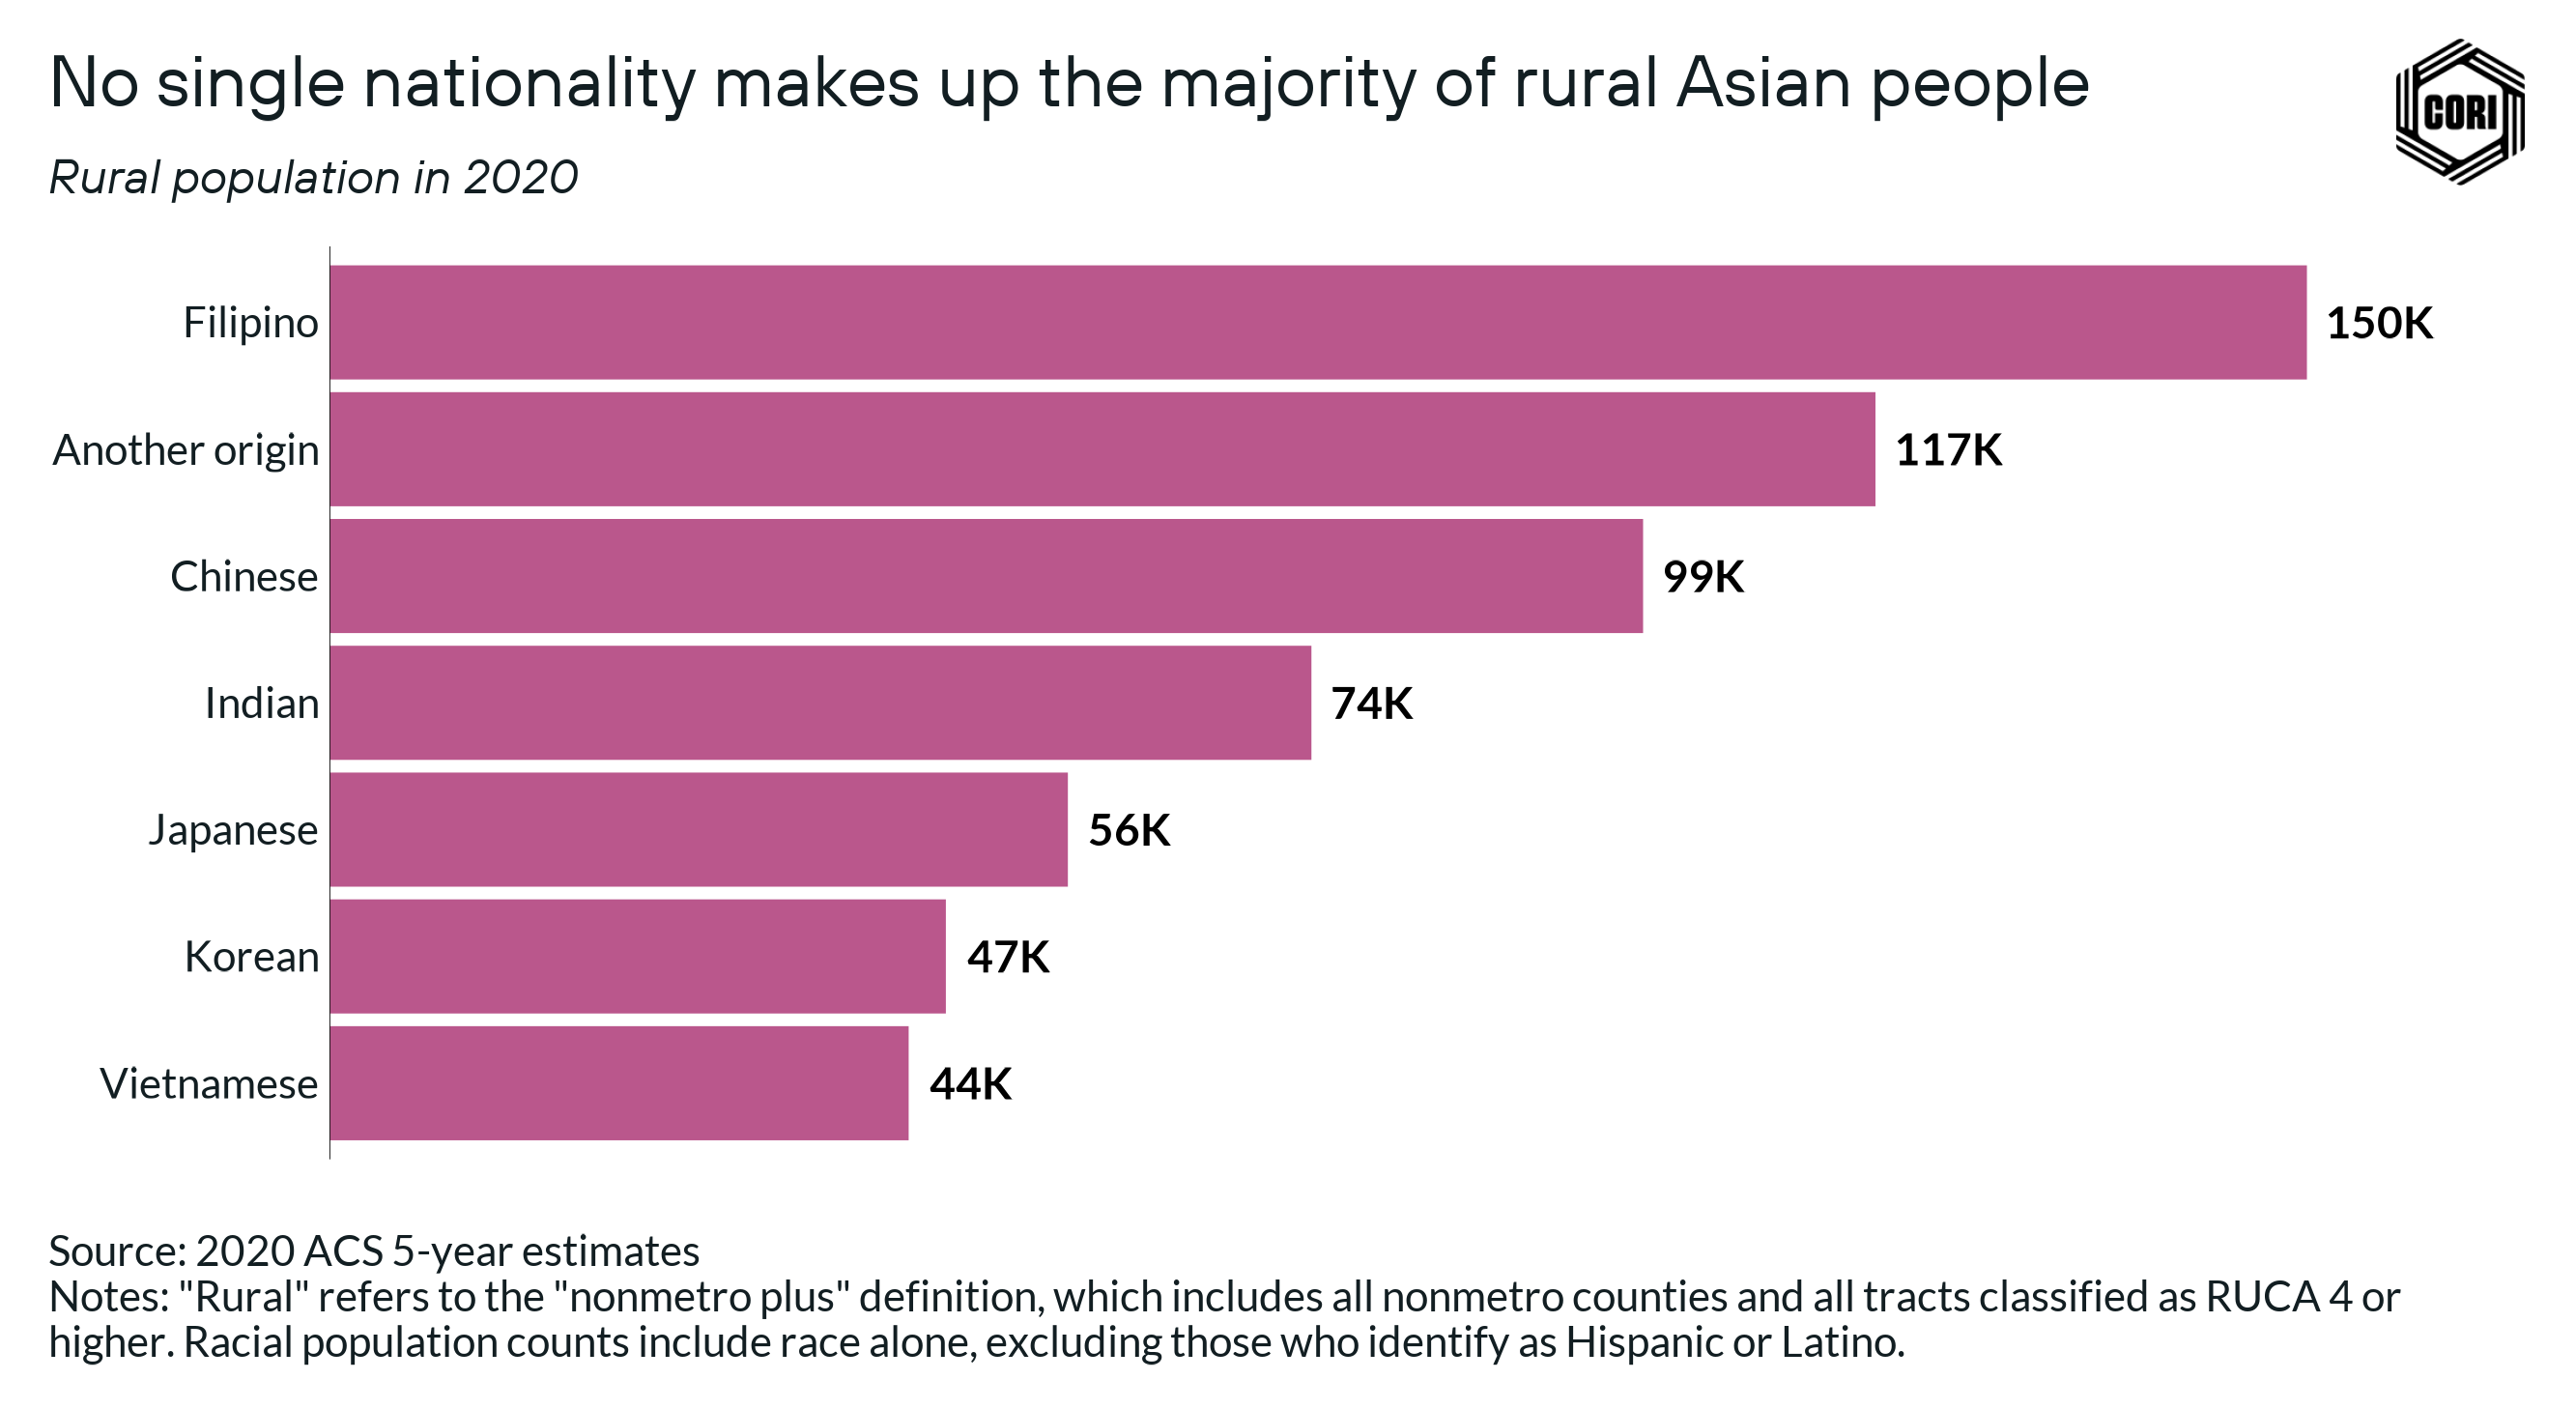
- There is no one nationality that makes up the majority of rural Asians: the most people identifying as Asian in rural America today have roots in the Philippines, followed by China, India, and Japan
- Although small, the growth of Asian populations in rural places is driven by immigration — 74% of the rural Asian population is foreign-born.
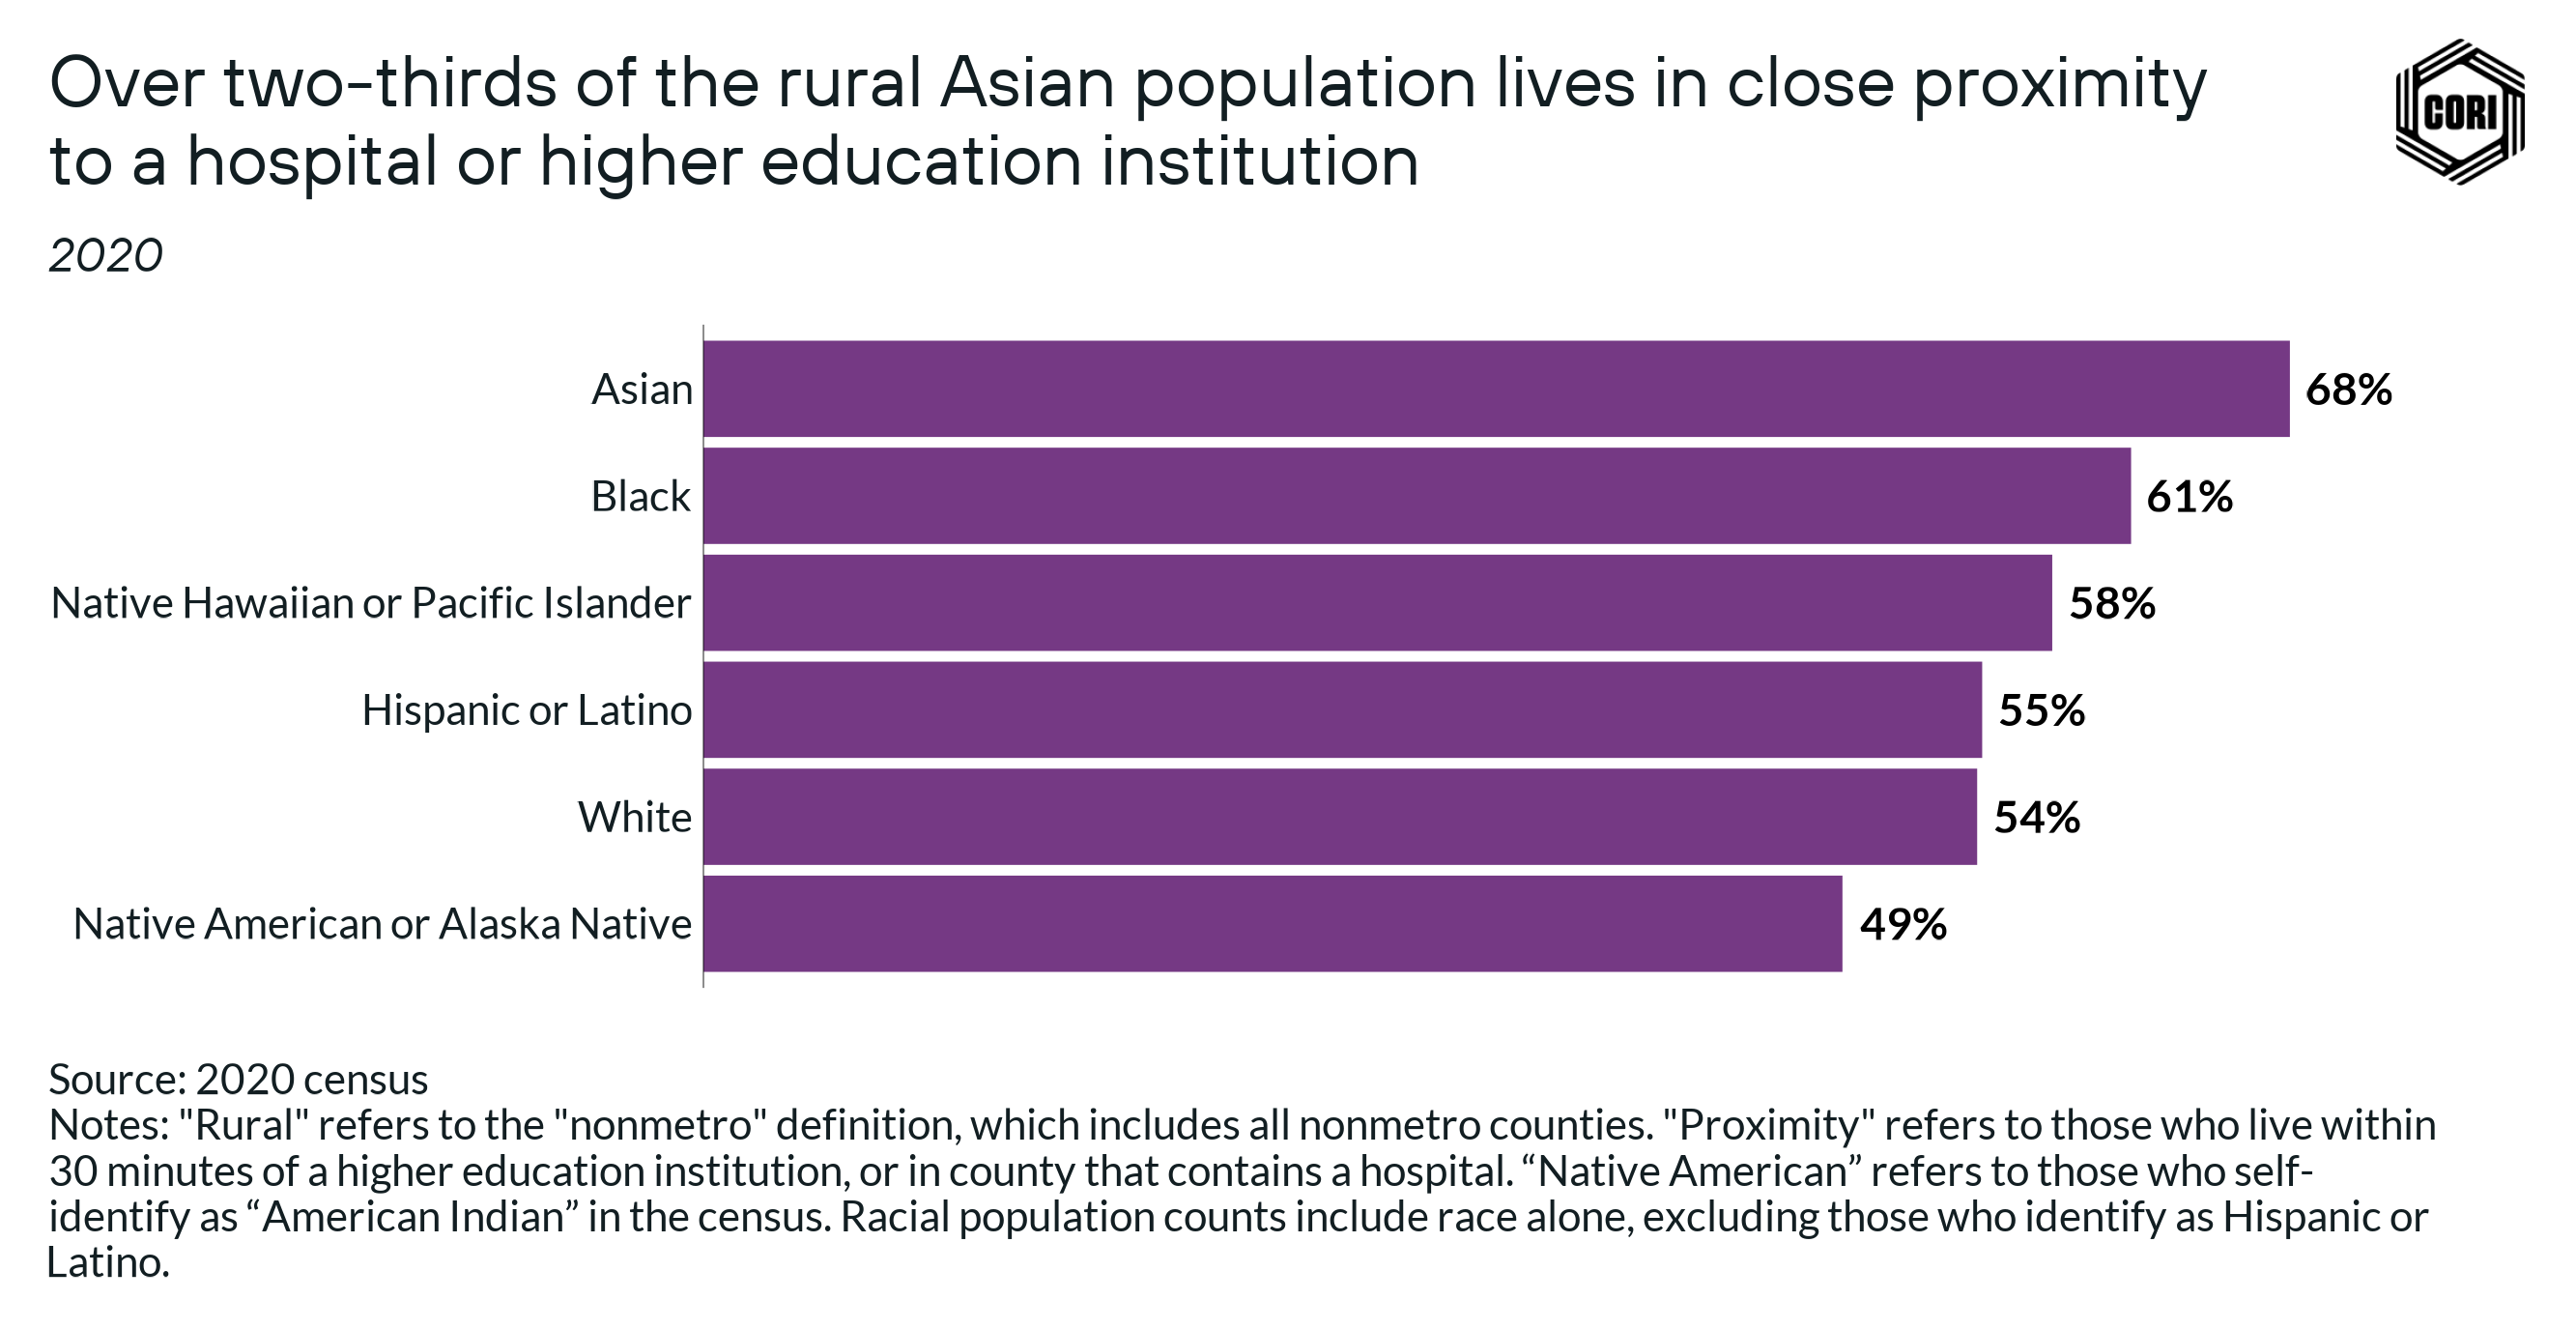
- Overall, 67% of the rural Asian population lives in close proximity to a hospital or higher education institution, including 74% of South Central Asian immigrants (primarily from India) living in rural America.
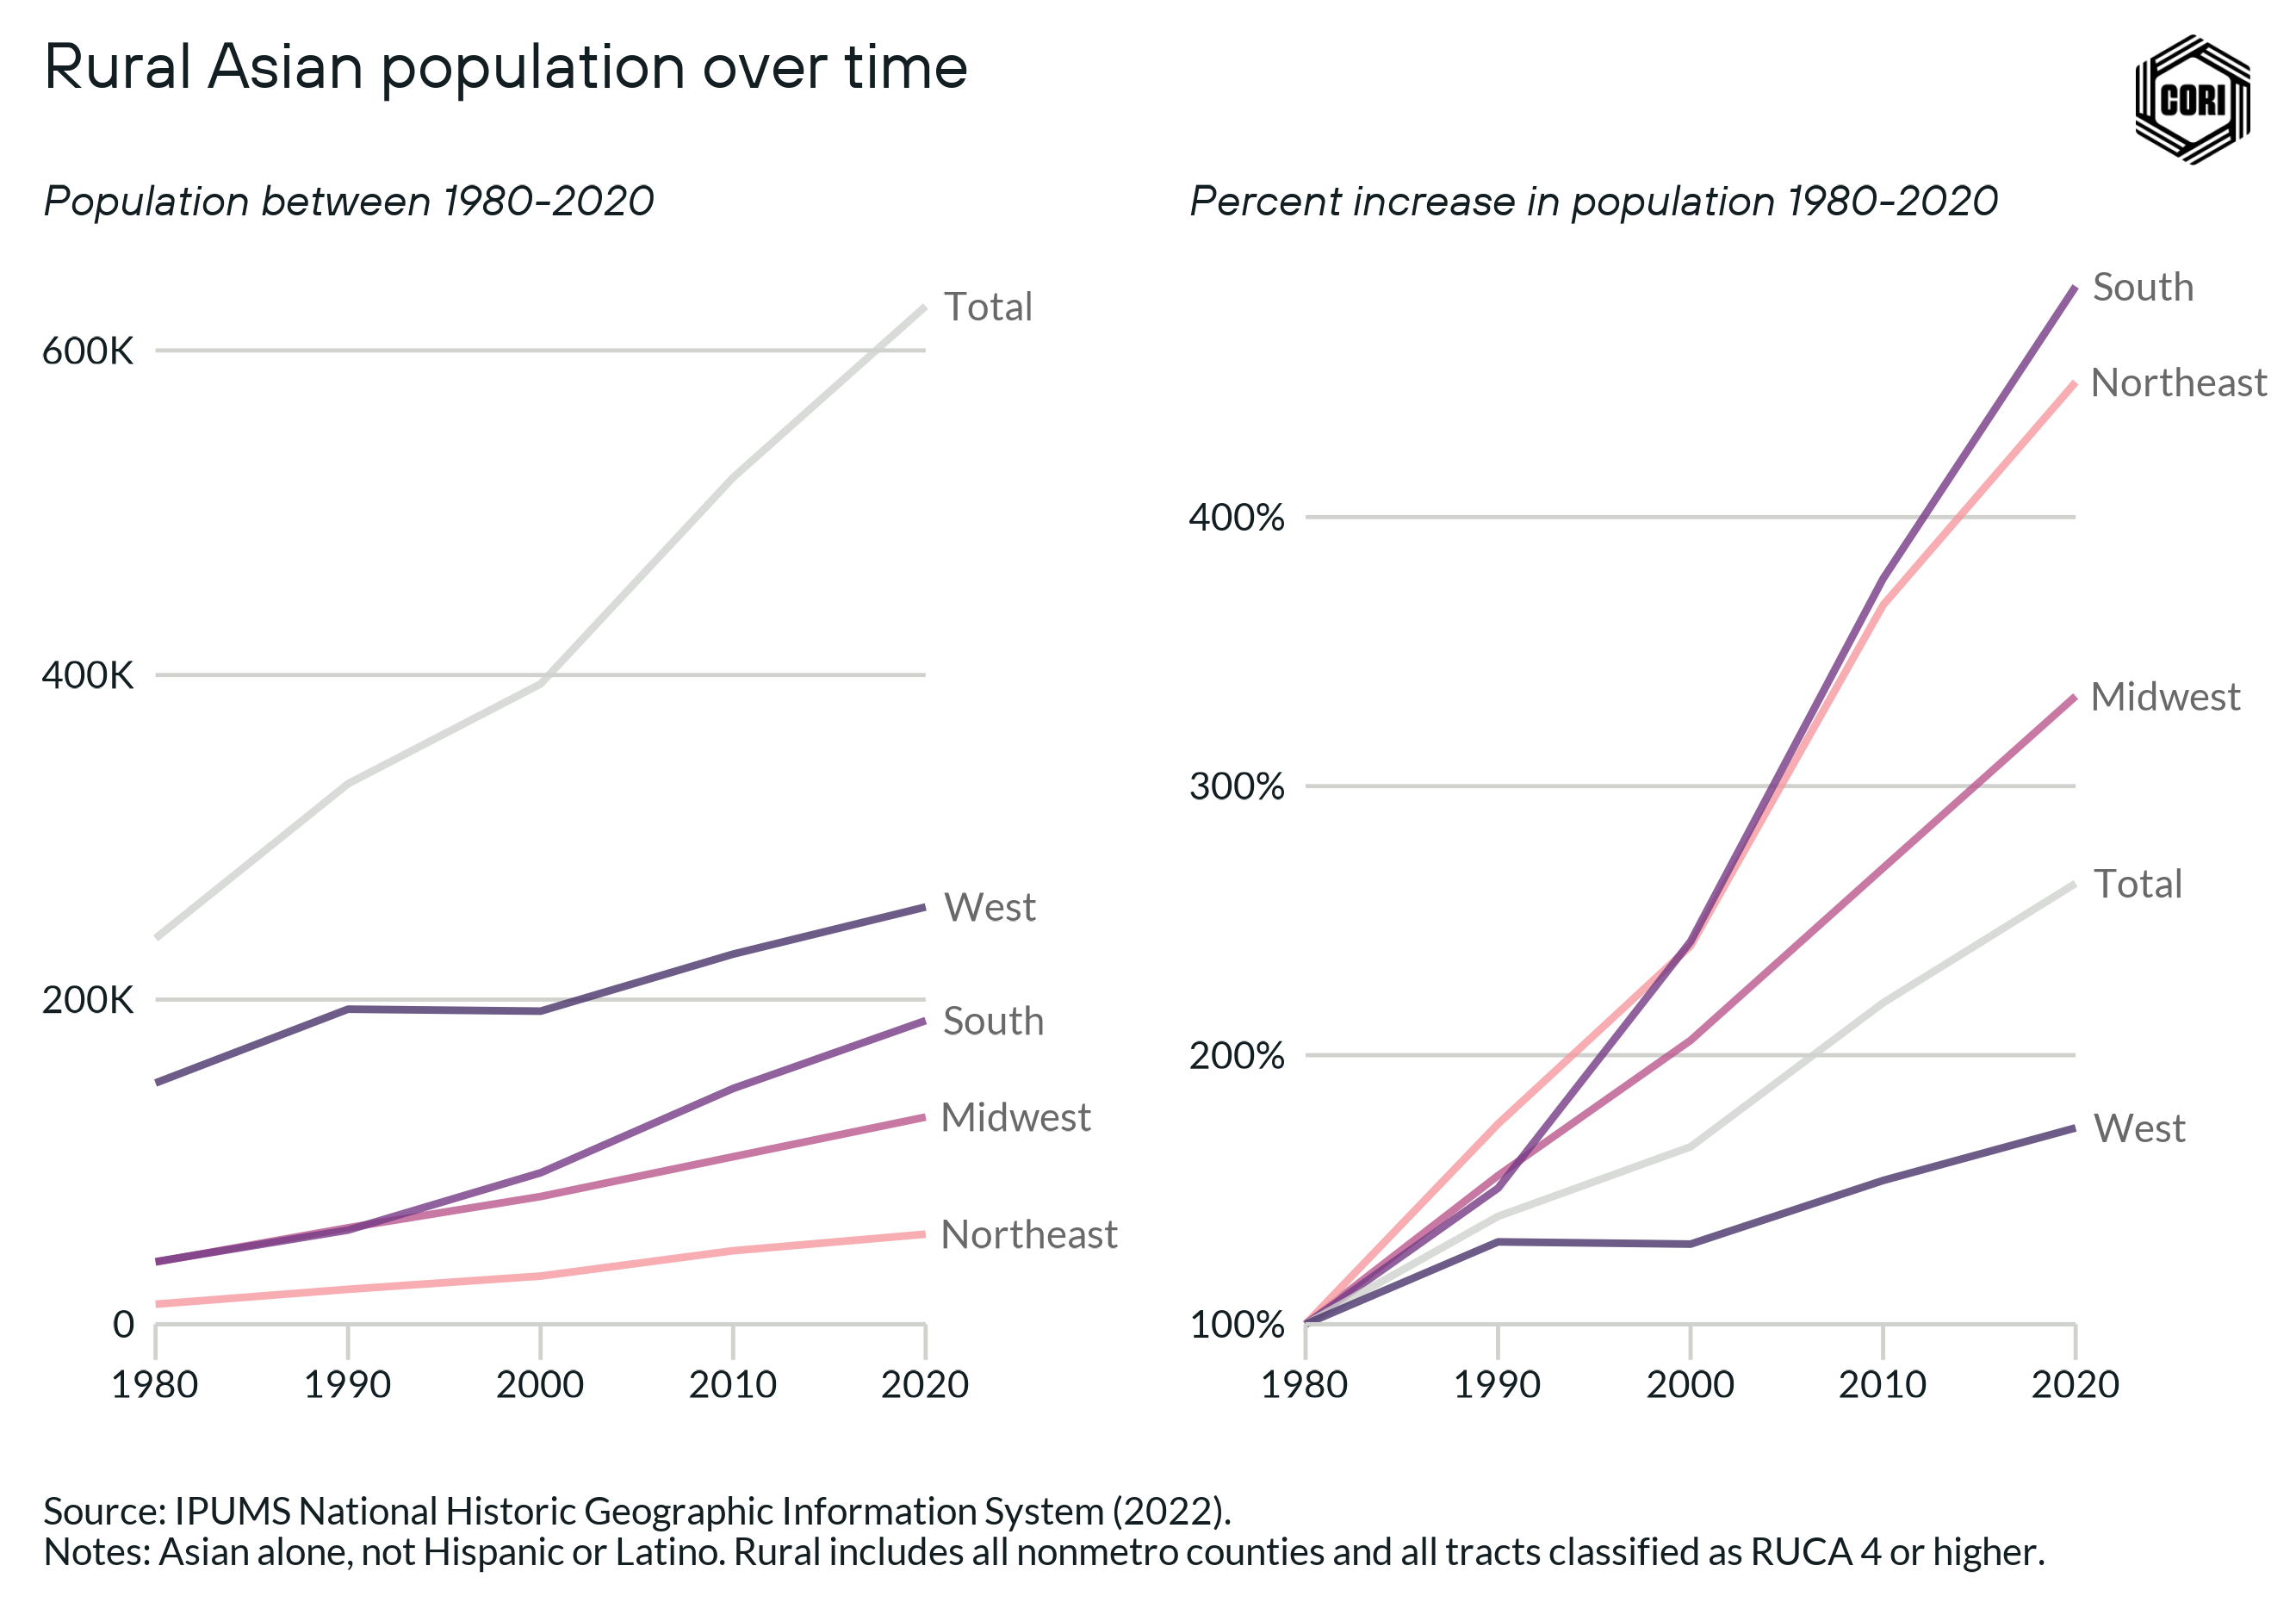
- Although the rural Asian population is numerically quite small, on the whole, the population has seen almost universal growth across all regions.
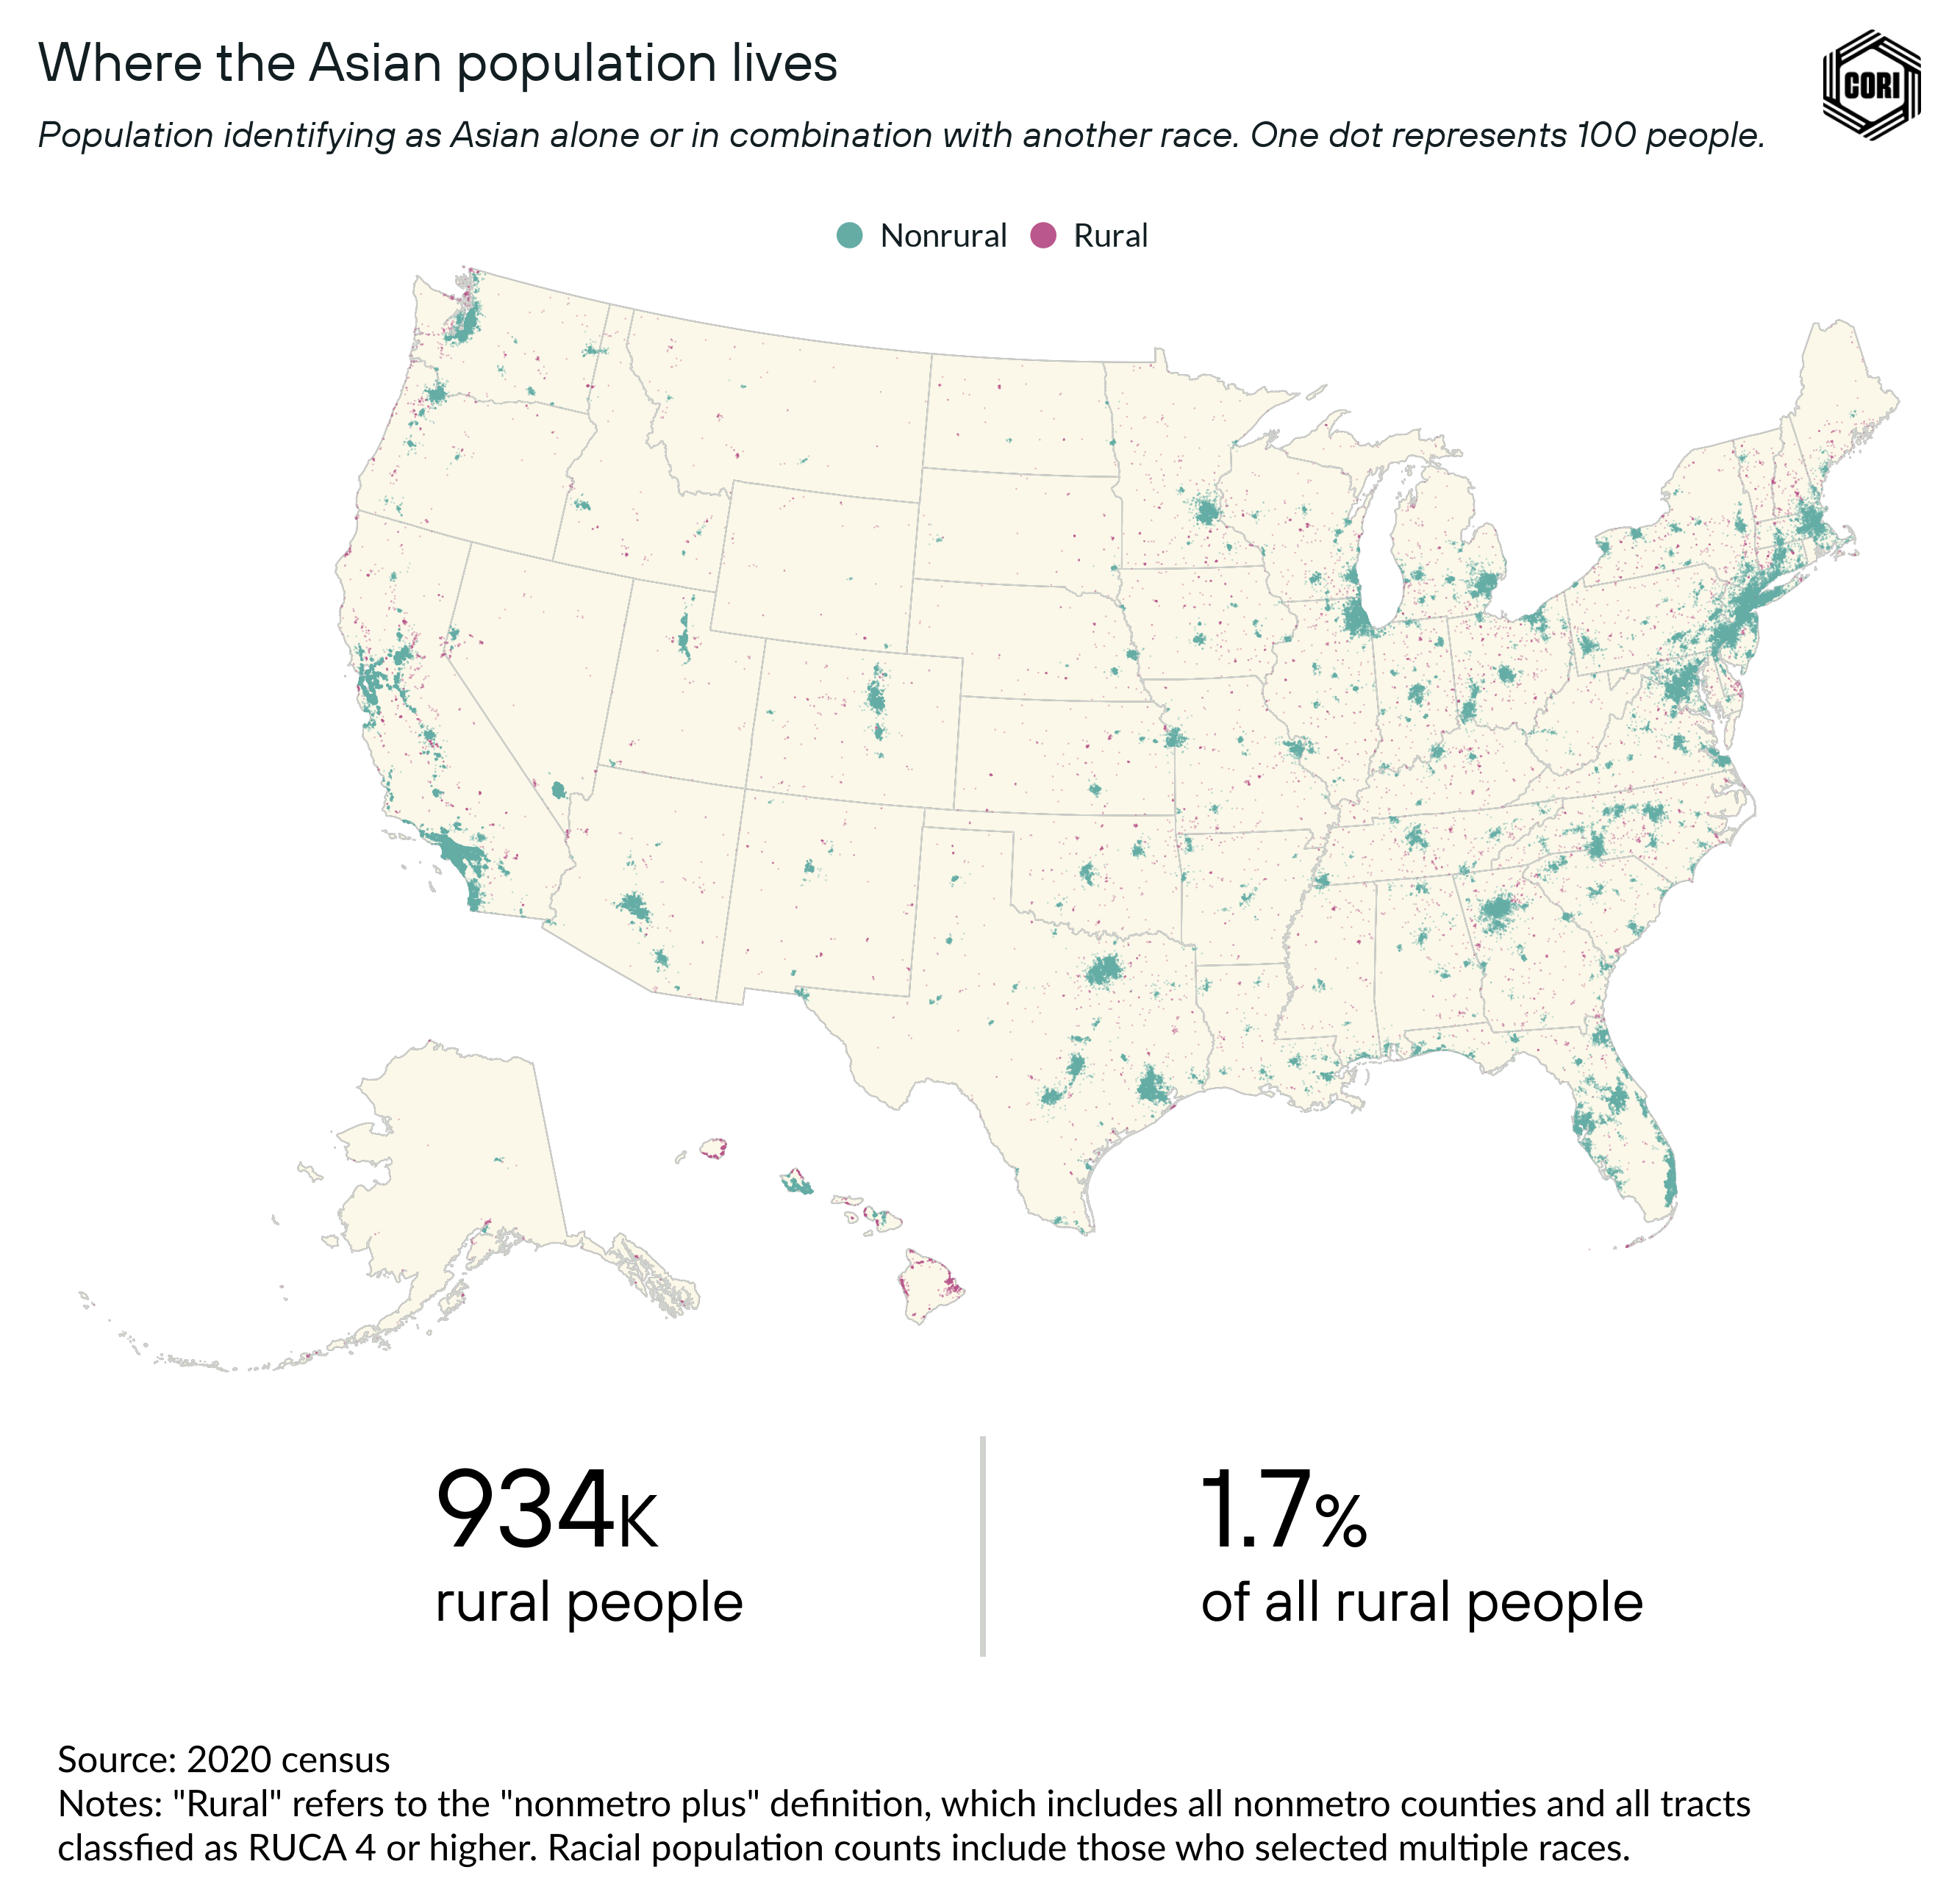
Across the racial and ethnic groups categorized in the census, Asian Americans and Asian immigrants represent one of the smallest rural populations: 934,000 people, which accounts for only 1.7% of rural people (above). The vast majority of the Asian population in the U.S. is located in cities, but even so, there is a rich history of Asian populations living in rural places.
How the U.S. census defines “Asian”
Today, the census’ “Asian” category encompasses an enormous number of people who represent a vast swath of cultures and land. In the 2020 census, the category included, “A person having origins in any of the original peoples of the Far East, Southeast Asia, or the Indian subcontinent including, for example, Cambodia, China, India, Japan, Korea, Malaysia, Pakistan, the Philippine Islands, Thailand, and Vietnam.”
This is quite different from how people of Asian descent have been represented historically. The first category for Asian representation — “Chinese” — appeared in 1860. “Japanese” was added as an option in 1890. A century later, in 1980, the options in the “Asian” grouping included “Asian Indian, Chinese, Filipino, Japanese, Korean, and Vietnamese.”
In summary, the contemporary census categorization of “Asian” groups together an immense number of people from an incredibly diverse array of cultures and origins — and the current category accounts for about 22 million people in the U.S. In this piece, we use the term “Asian” when we are referring to those who selected “Asian” and not Hispanic or Latino in the census, unless specified otherwise.
Factors that have shaped the rural Asian population today
Immigration has always played a central role in the growth of Asian populations across the country — and on a national level, it is important to understand the long history of restrictive migration that many people from across the Asian continent have faced when moving to the U.S.
Stemming back to the 1800s, Chinese were among the earlier waves of Asian migration to the U.S. and faced the initial brunt of xenophobic policies and attitudes, like the Chinese Exclusion Act. These types of harsh restrictions and xenophobic policies expanded to other Asian groups in the early 1900s, in large part due to shifting migration dynamics as more Japanese and Koreans came the country as laborers.
The exclusions impacted both rural and urban places, but in rural areas specifically, the Asian population faced some particular economic and social barriers. Agriculture played a significant part in the historical experiences of Asian people living in rural places:
- In 1913, the Alien Land Act mandated that American citizenship was a necessary prerequisite for purchasing land — meaning that all Asian immigrants were barred from being landowners, a law that was on the books until the 1950s. This was something that particularly impacted Japanese, as starting in the mid-1800s, many were recruited as agricultural contract laborers, yet they were barred from owning land themselves.
- By the 1920s, Filipinos came to represent the largest Asian farmworker population in the West. The majority were in Hawaii, as thousands were sponsored to work on sugar plantations. Across the west, Filipinos took on some of the lowest-paying jobs in the fields, eventually becoming some of the strongest players in the farmworkers rights movement.
- In the 1940s, rural places came to play a different role for many people of Japanese descent: During the period of Japanese internment, over 120,000 people were sent to 10 concentration camps, the two largest of which were located in rural Arkansas. When authorities began to push the Japanese out of these camps in 1943, many were ushered into communities that were not their own — including in rural places, but some also chose to move to rural areas to reclaim agricultural livelihoods.
In summary, Asian immigrants and Asian Americans from across the Asian continent have historically faced exclusionary policies in the U.S. that restricted movement and employment, even as agriculture came to serve as a powerful conduit for opportunity among rural Asian communities.
The contemporary rural Asian population is predominantly foreign-born, and like other immigrant groups, economic opportunities play a major role in settlement patterns. Economically speaking, today’s rural Asian workforce is incredibly diverse, and spans from low-wage factory workers, to high-salaried hospital employees.
On the whole, there are two major categories of employment for the rural Asian population: low-wage industry employment like manufacturing and food processing, and high-wage employment like higher education and healthcare.
Refugee resettlement has played a contributing role in low-wage industry employment. For example, Vietnamese, Laotian, and Burmese are three groups that have notable rural populations, and also that have been historically coming to the U.S. as resettled refugees. Poverty rates of these groups are high, and they tend to be employed in low-wage industries.
In Iowa, for one, the majority of the 10,000 refugees from Myanmar living in the state work in meatpacking. Even back in the mid-1960s, historians recount how the majority of meatpacking plants in Garden City, Kansas, were primarily staffed by Vietnamese and Lao refugees; and in Greeley, Colorado, refugee resettlement agencies helped refugees from across Burma in getting jobs at a plant there — a dynamic similar to that discussed in the section above on the rural Hispanic and Latino population around hiring immigrant workers into industrial low-wage jobs. While refugees are initially placed in a location by refugee resettlement agencies, many refugees choose to subsequently relocate to other areas where there is an established refugee community, along with job opportunities in low-wage industries.
Another factor that drives the growth of the Asian population in many rural communities are industries like higher education and healthcare. These industries attract Asians students, researchers, and medical professionals, with the most significant portion coming from Eastern and South Central Asia.
Compared to the average rural worker, rural Asian workers are nearly 40% more likely to work in an educational occupation, 60% more likely to work in a medical professional occupation, and 250% times more likely to work in a tech occupation (2020 ACS-nonmetro).
Overall, 67% of the rural Asian population lives in close proximity to a hospital or higher education institution, including 74% of South Central Asian immigrants (primarily from India) living in rural America (below). While some Asian immigrants are attracted to rural hubs home to higher educational and healthcare organizations to work in those industries, others are attracted to the same rural hubs to start businesses and work in retail and service sectors.
These different dynamics across the diversity of Asian immigrants exemplifies how disaggregating data on a deeper level within a particular racial or ethnic group provides a deeper understanding of socioeconomic dynamics.
Going beyond the top-line census numbers on the rural Asian population
Culturally and economically, the rural Asian population is incredibly diverse, even though the population is numerically small. Unlike the case for the Hispanic or Latino demographics, where roughly 75% of the Hispanic or Latino population in rural places has roots in Mexico, there is no one nationality that makes up the majority of rural Asian people: The most people identifying as Asian in rural America today have roots in the Philippines, followed by China, India, and Japan (below).
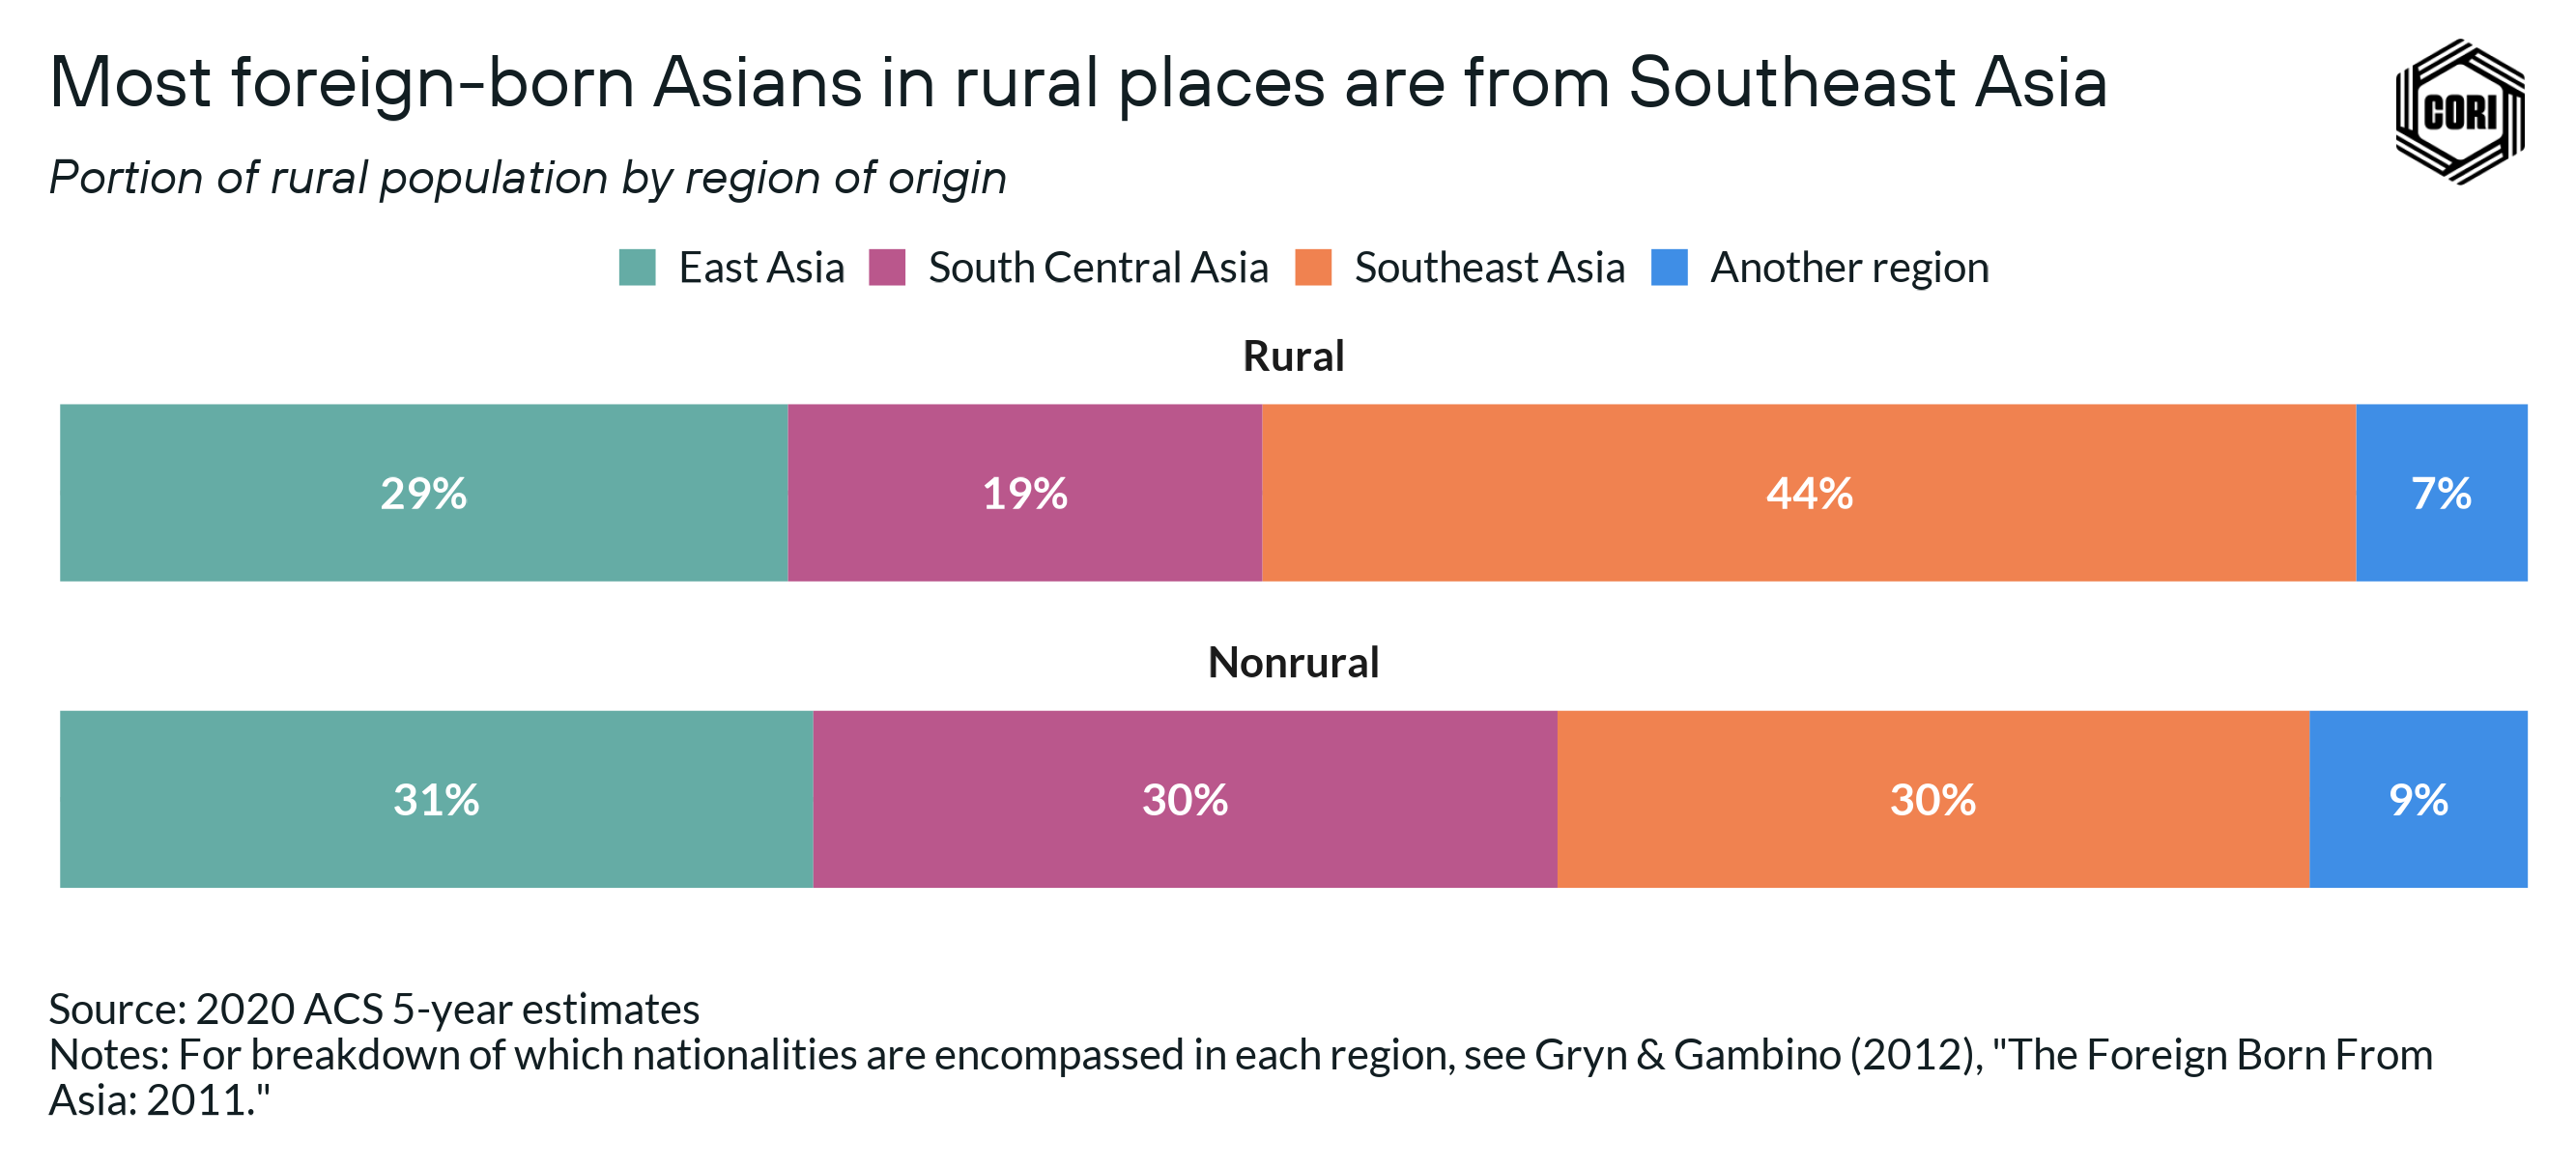
Today, the growth of Asian populations in rural places is driven by immigration — 74% of the rural Asian population is foreign-born. Compared to nonrural areas, Asian immigrants to rural America are disproportionately from Southeast Asia, which includes the Philippines, Vietnam, Thailand, and Laos (below). Conversely, rural America has attracted a much smaller share of Asian immigrants from South Central Asia compared to nonrural areas.
Digging into data around nationality and employment within the Asian population reflects our premise from Part 1 of avoiding “taking census data at face value” to see just how much diversity of lived experience exists within even a small population.
Growth trends of the rural Asian population
Although the rural Asian population is numerically quite small, on the whole, the population has seen almost universal growth across all regions (below). As is noted earlier, the Asian population is very diverse, representing a broad array of countries and cultures.
It is also the most dispersed rural population, differing from Black, Native, and Hispanic populations that are more likely to cluster within communities. Given this diversity, it is important to recognize the variety of dynamics which attract Asian people to rural areas and the context they create:
- Refugee resettlement programs created Asian communities across the country, attracting others to join friends and family. Refugees are most likely to work in low-wage jobs and experience higher rates of poverty.
- Higher education and healthcare have been magnets that have attracted Asian immigrants for both education and employment. Asian immigrants are disproportionately represented in several high skills occupations in rural America, serving rural communities in critical roles like professors and doctors.
- Asian immigrants move to rural areas to pursue economic opportunity, starting businesses and working in retail and services sectors that serve the broader population.
Because of these vast differences, one-size-fits-all policies and programs targeting the rural Asian population are unlikely to be effective. Instead, it is particularly critical to disaggregate data on the rural Asian population to understand the diversity within the category, and to design policies and programs that take the specific context of different Asian groups into consideration.
![]()
The white population in rural America
Summary of data takeaways:
- The rural white population accounts for 47.3 million people, or 84.3% of rural people as a whole (when considering those who identify as white alone or in combination with another race).
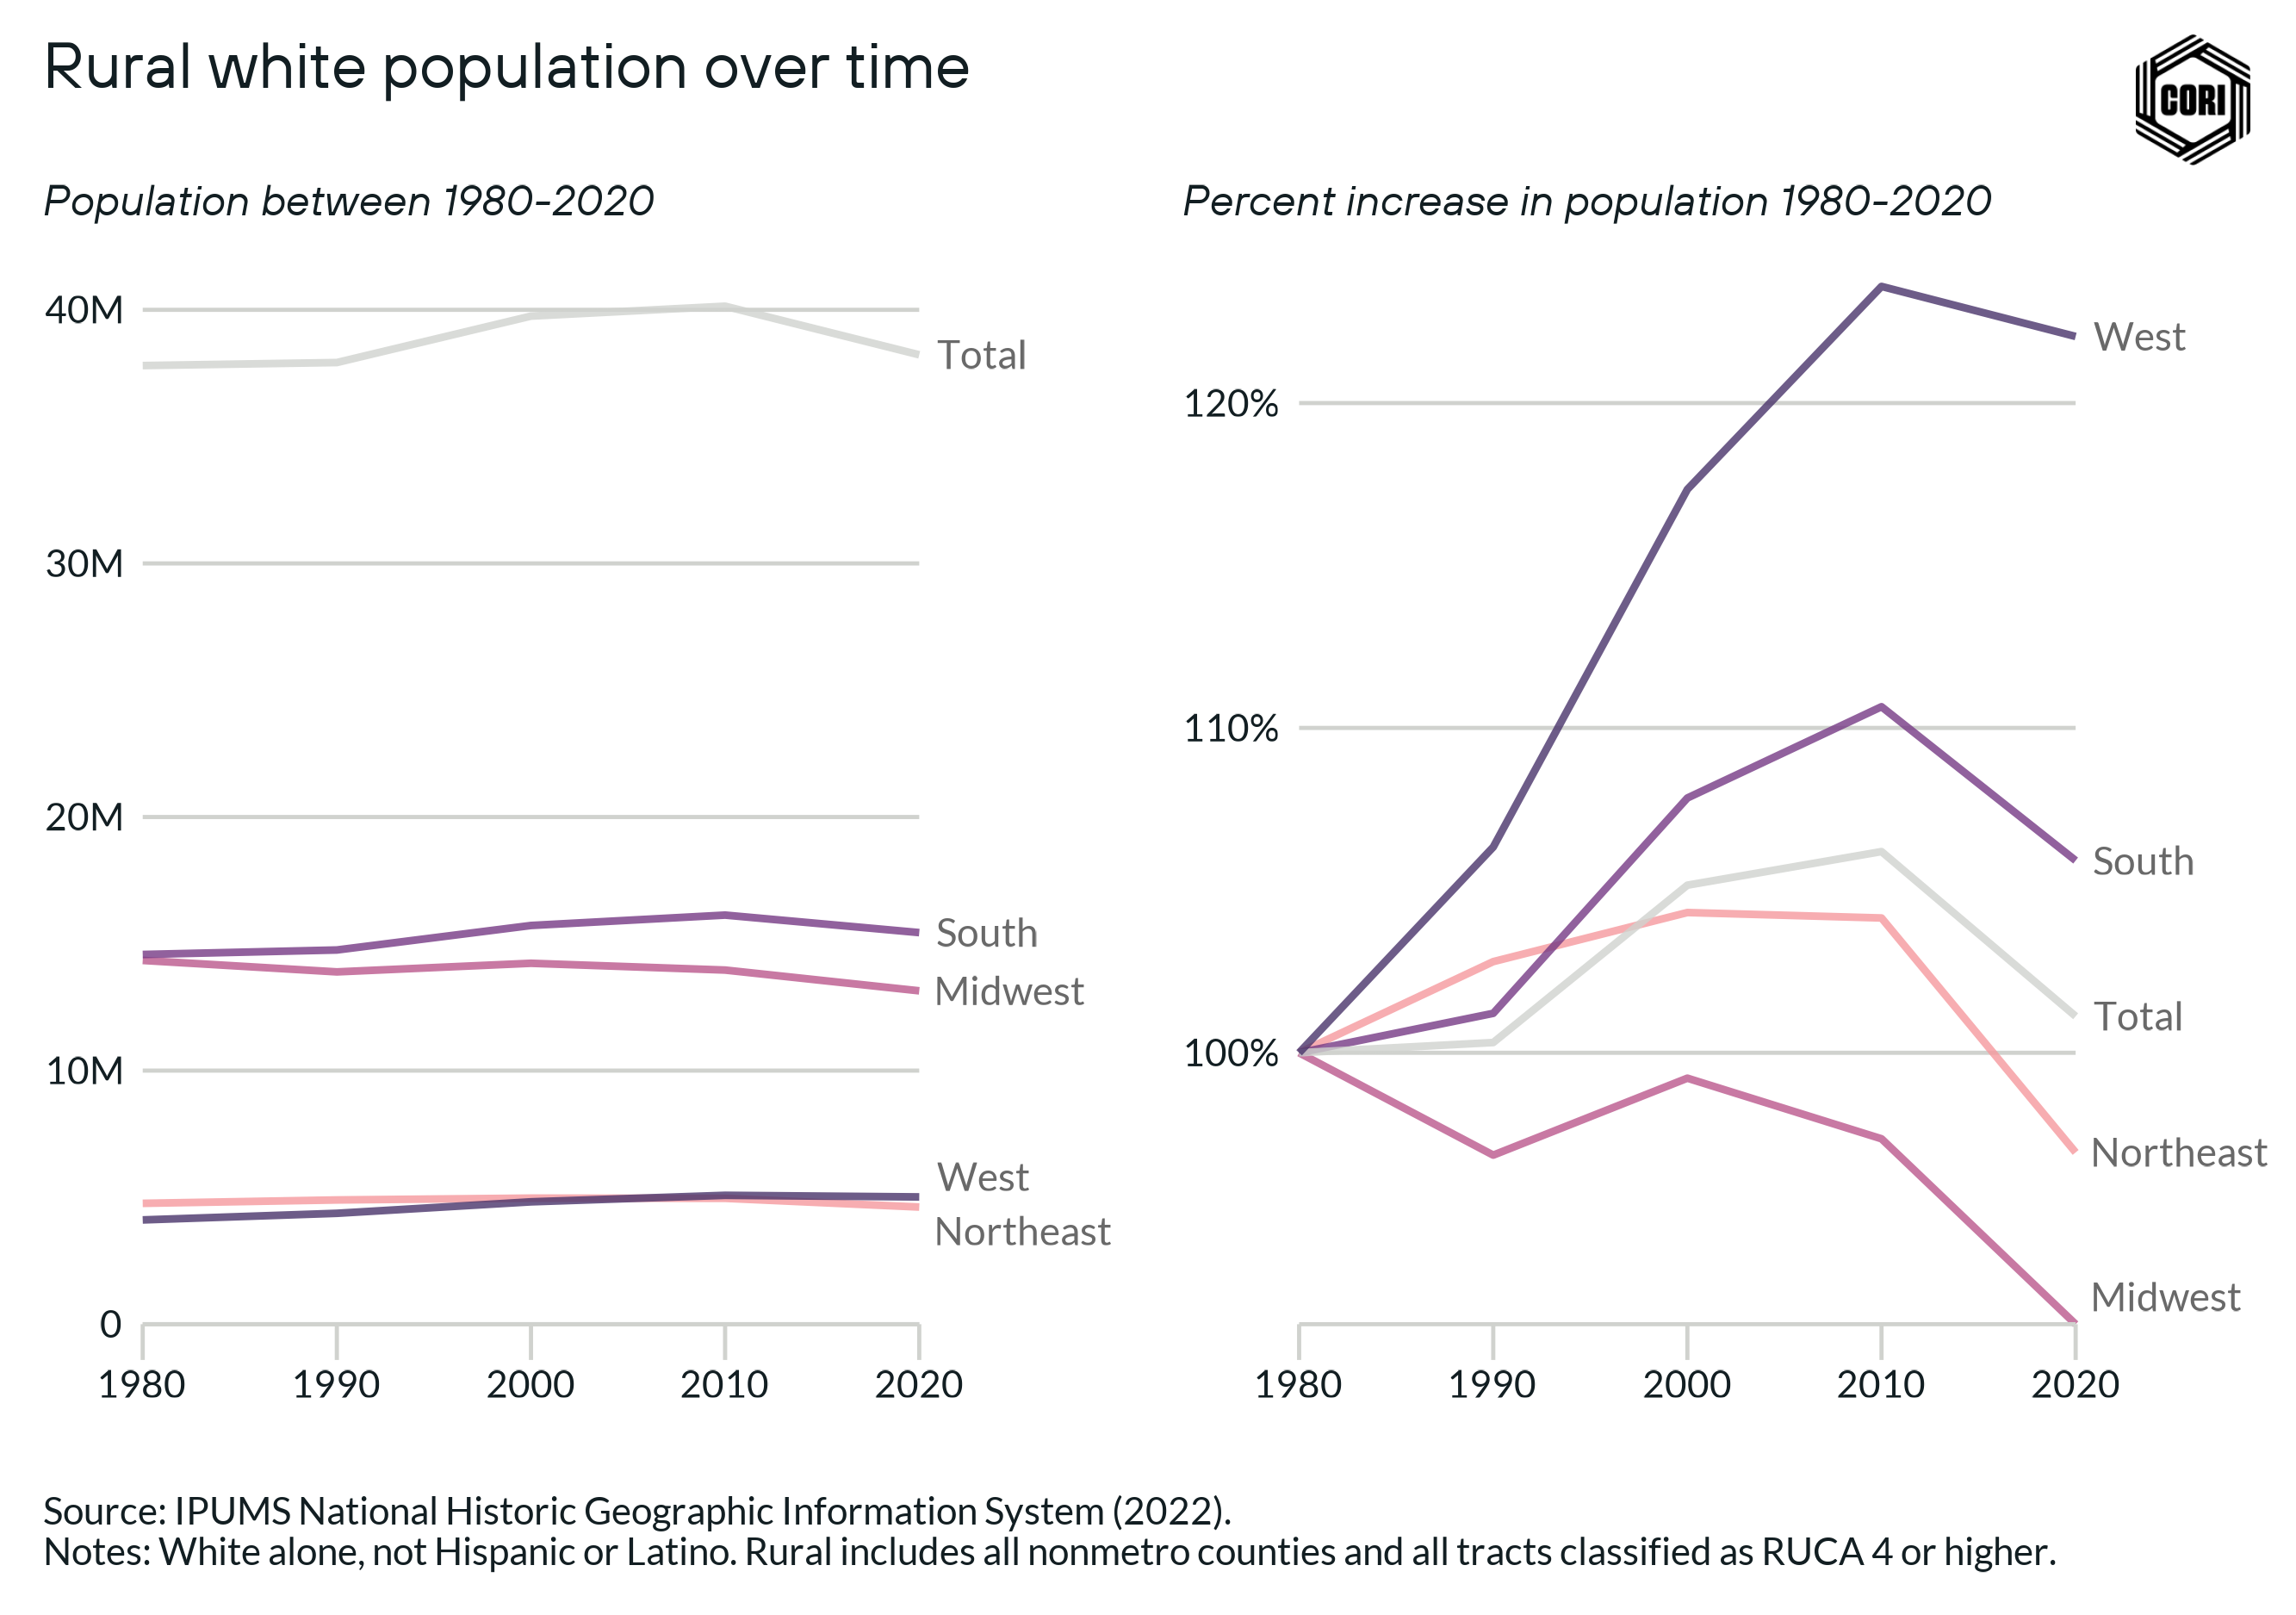
- Between 2010 and 2020, the rural white population fell by 4.8%, nearly double the decline in the white population overall.
- The most severe declines have been in the Midwest and Northeast.
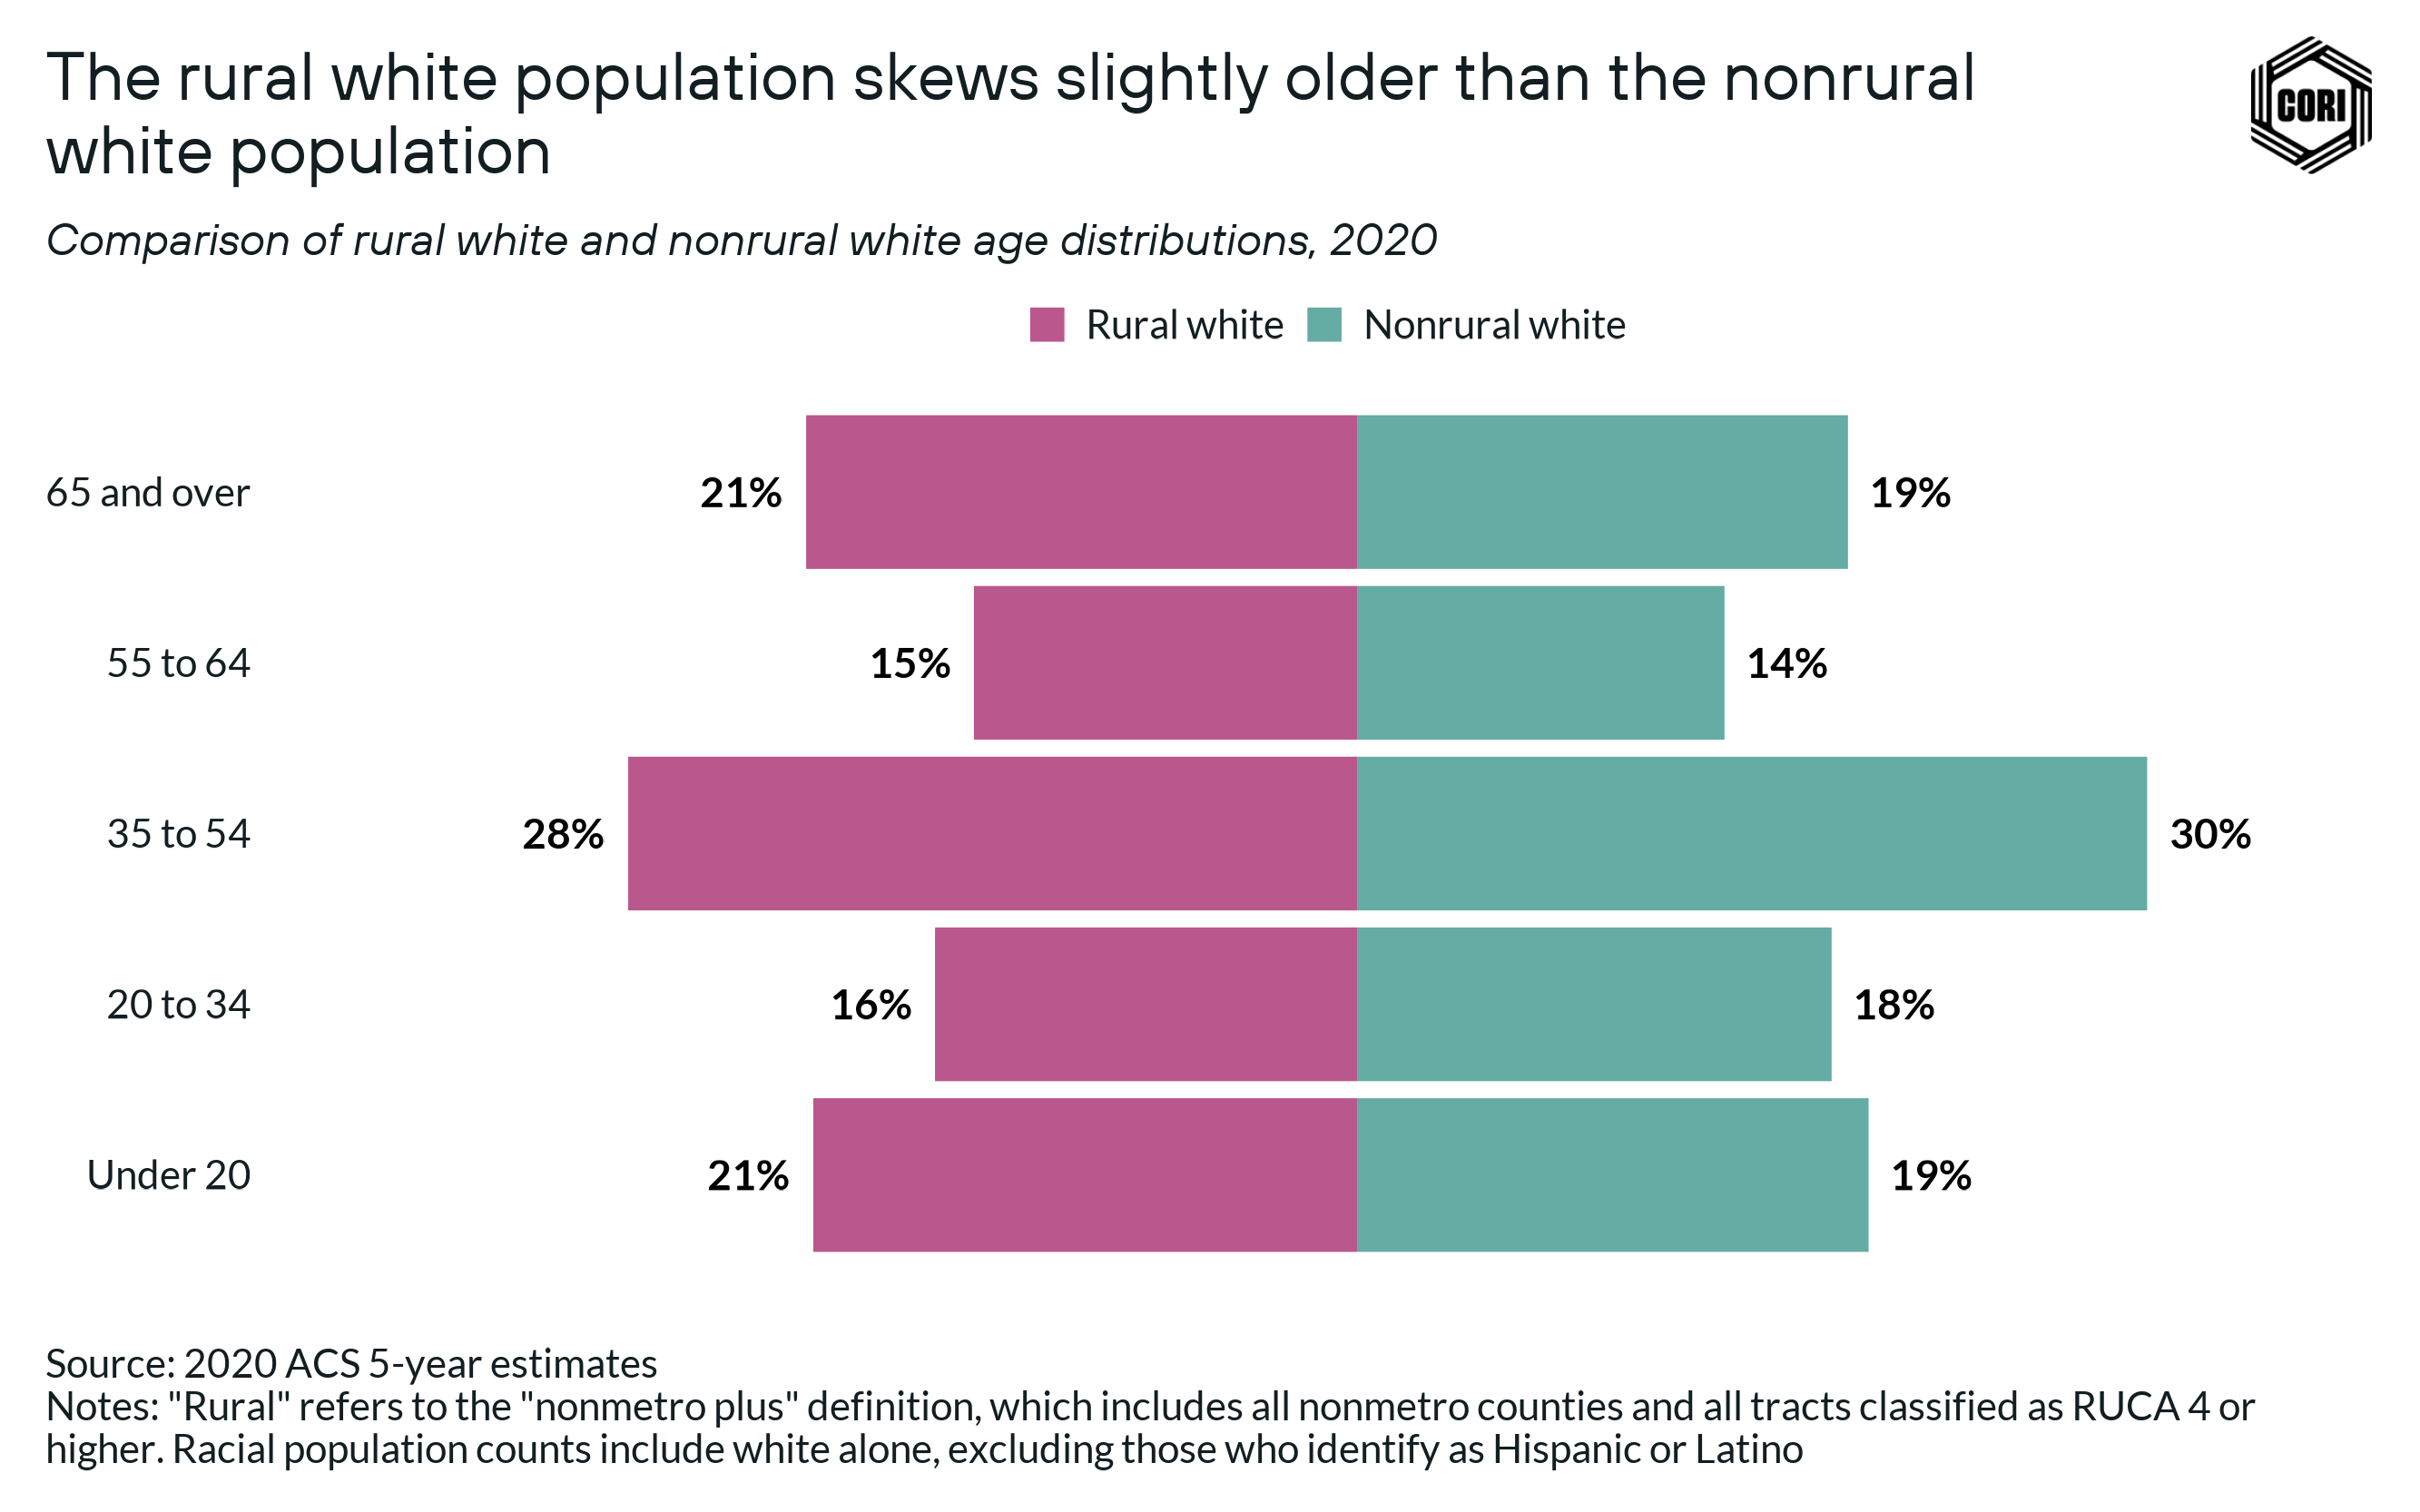
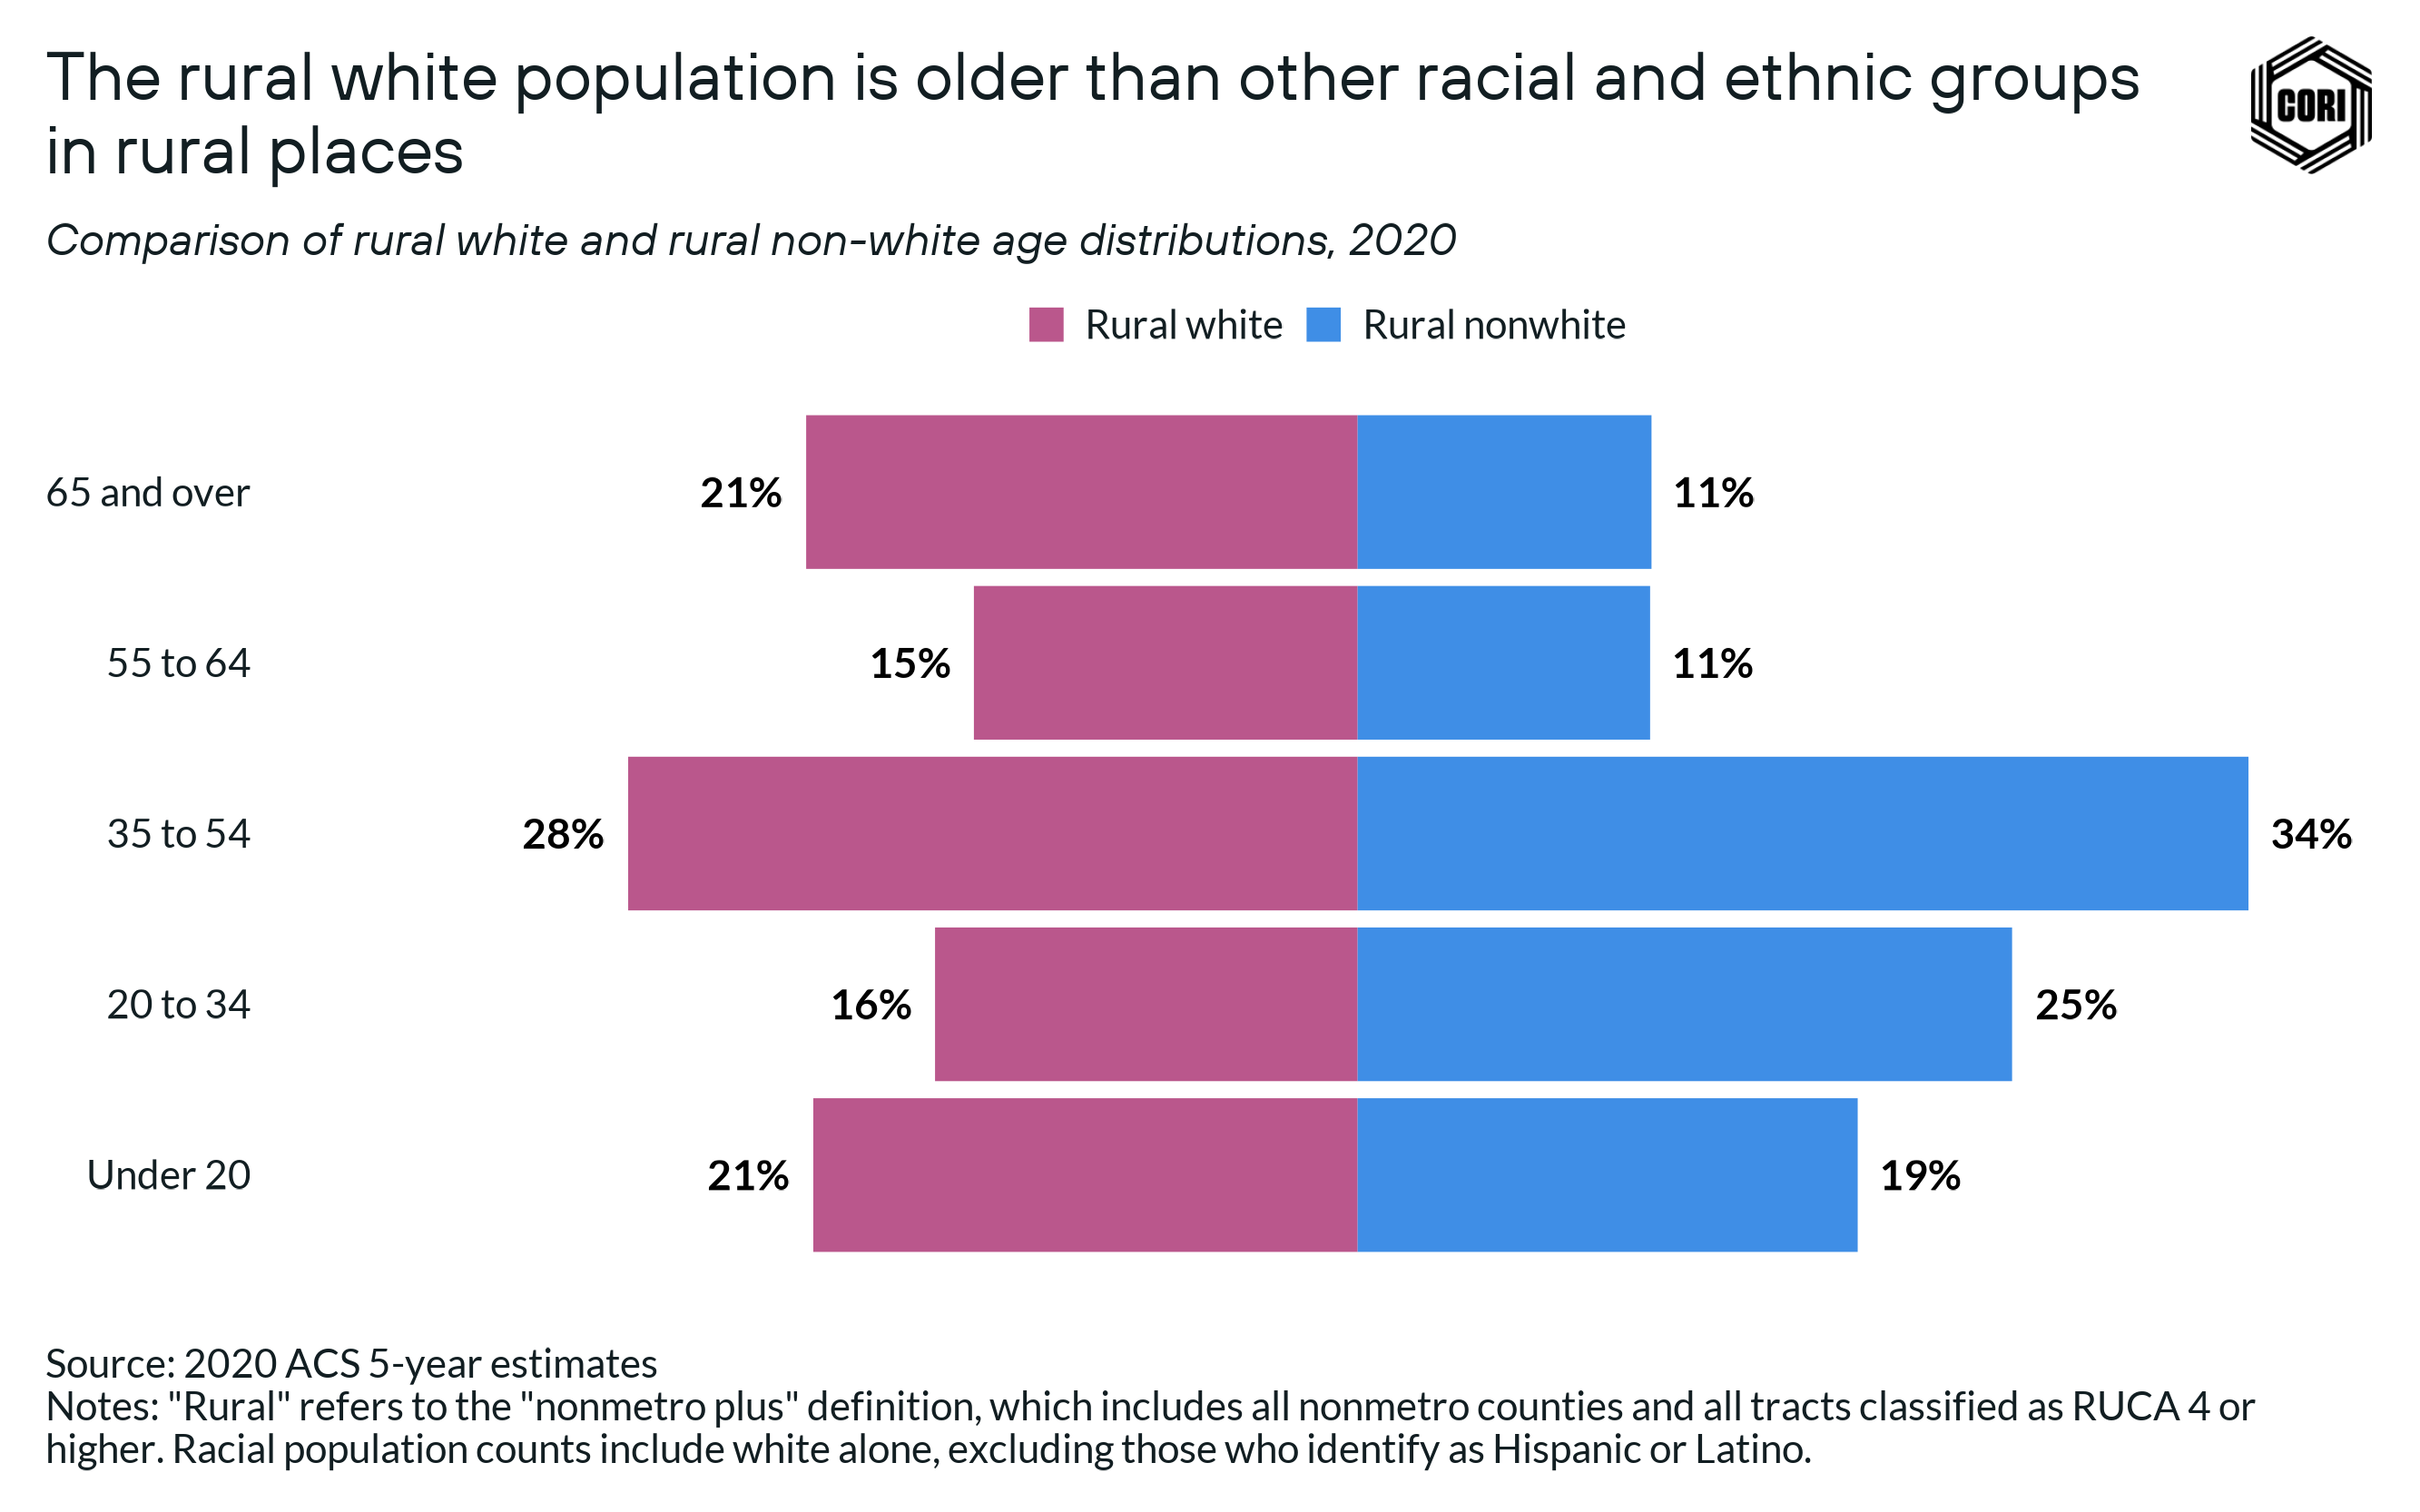
- The white population in rural places is older than both the nonrural white population and rural people of color in aggregate: 36% of the rural white population is over the age of 55, but only 22% of rural people of color and 33% of nonrural white people fall into this age bracket.
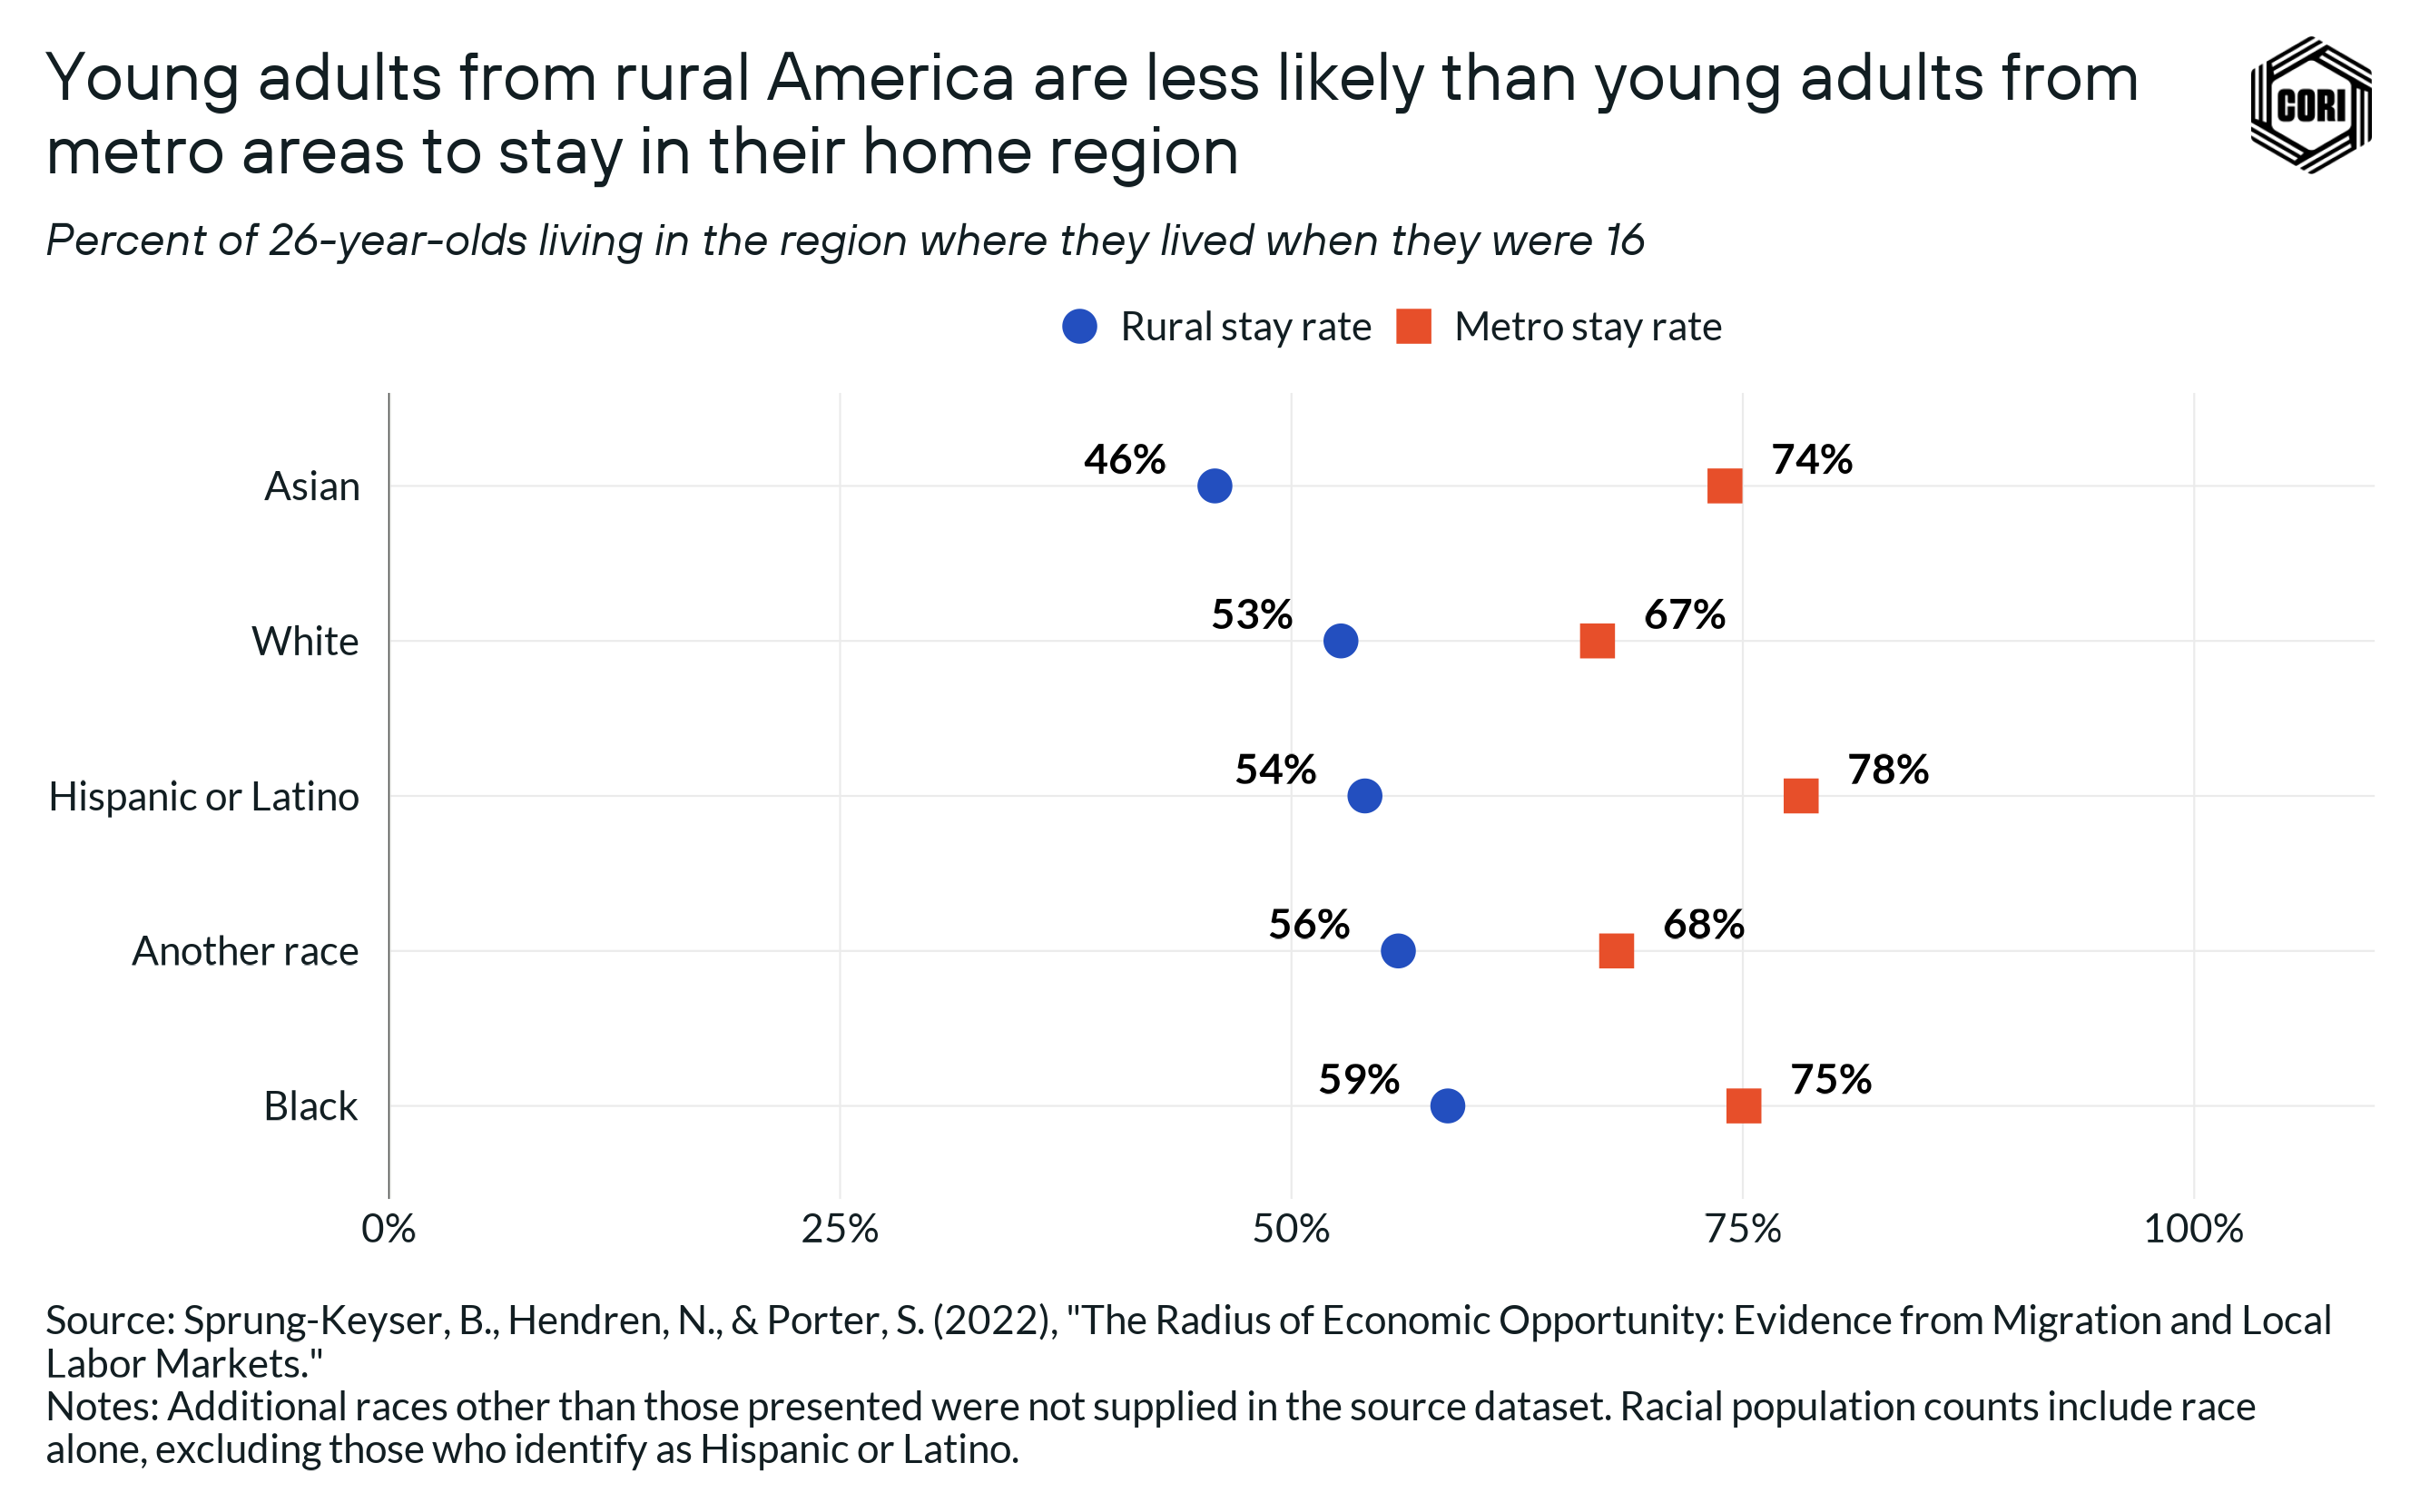
- For white millennials living in rural America at age 16, just 53% lived in their home region (defined by multi-county commuting zones) at age 26, compared to 67% of white millennials born in metro areas.
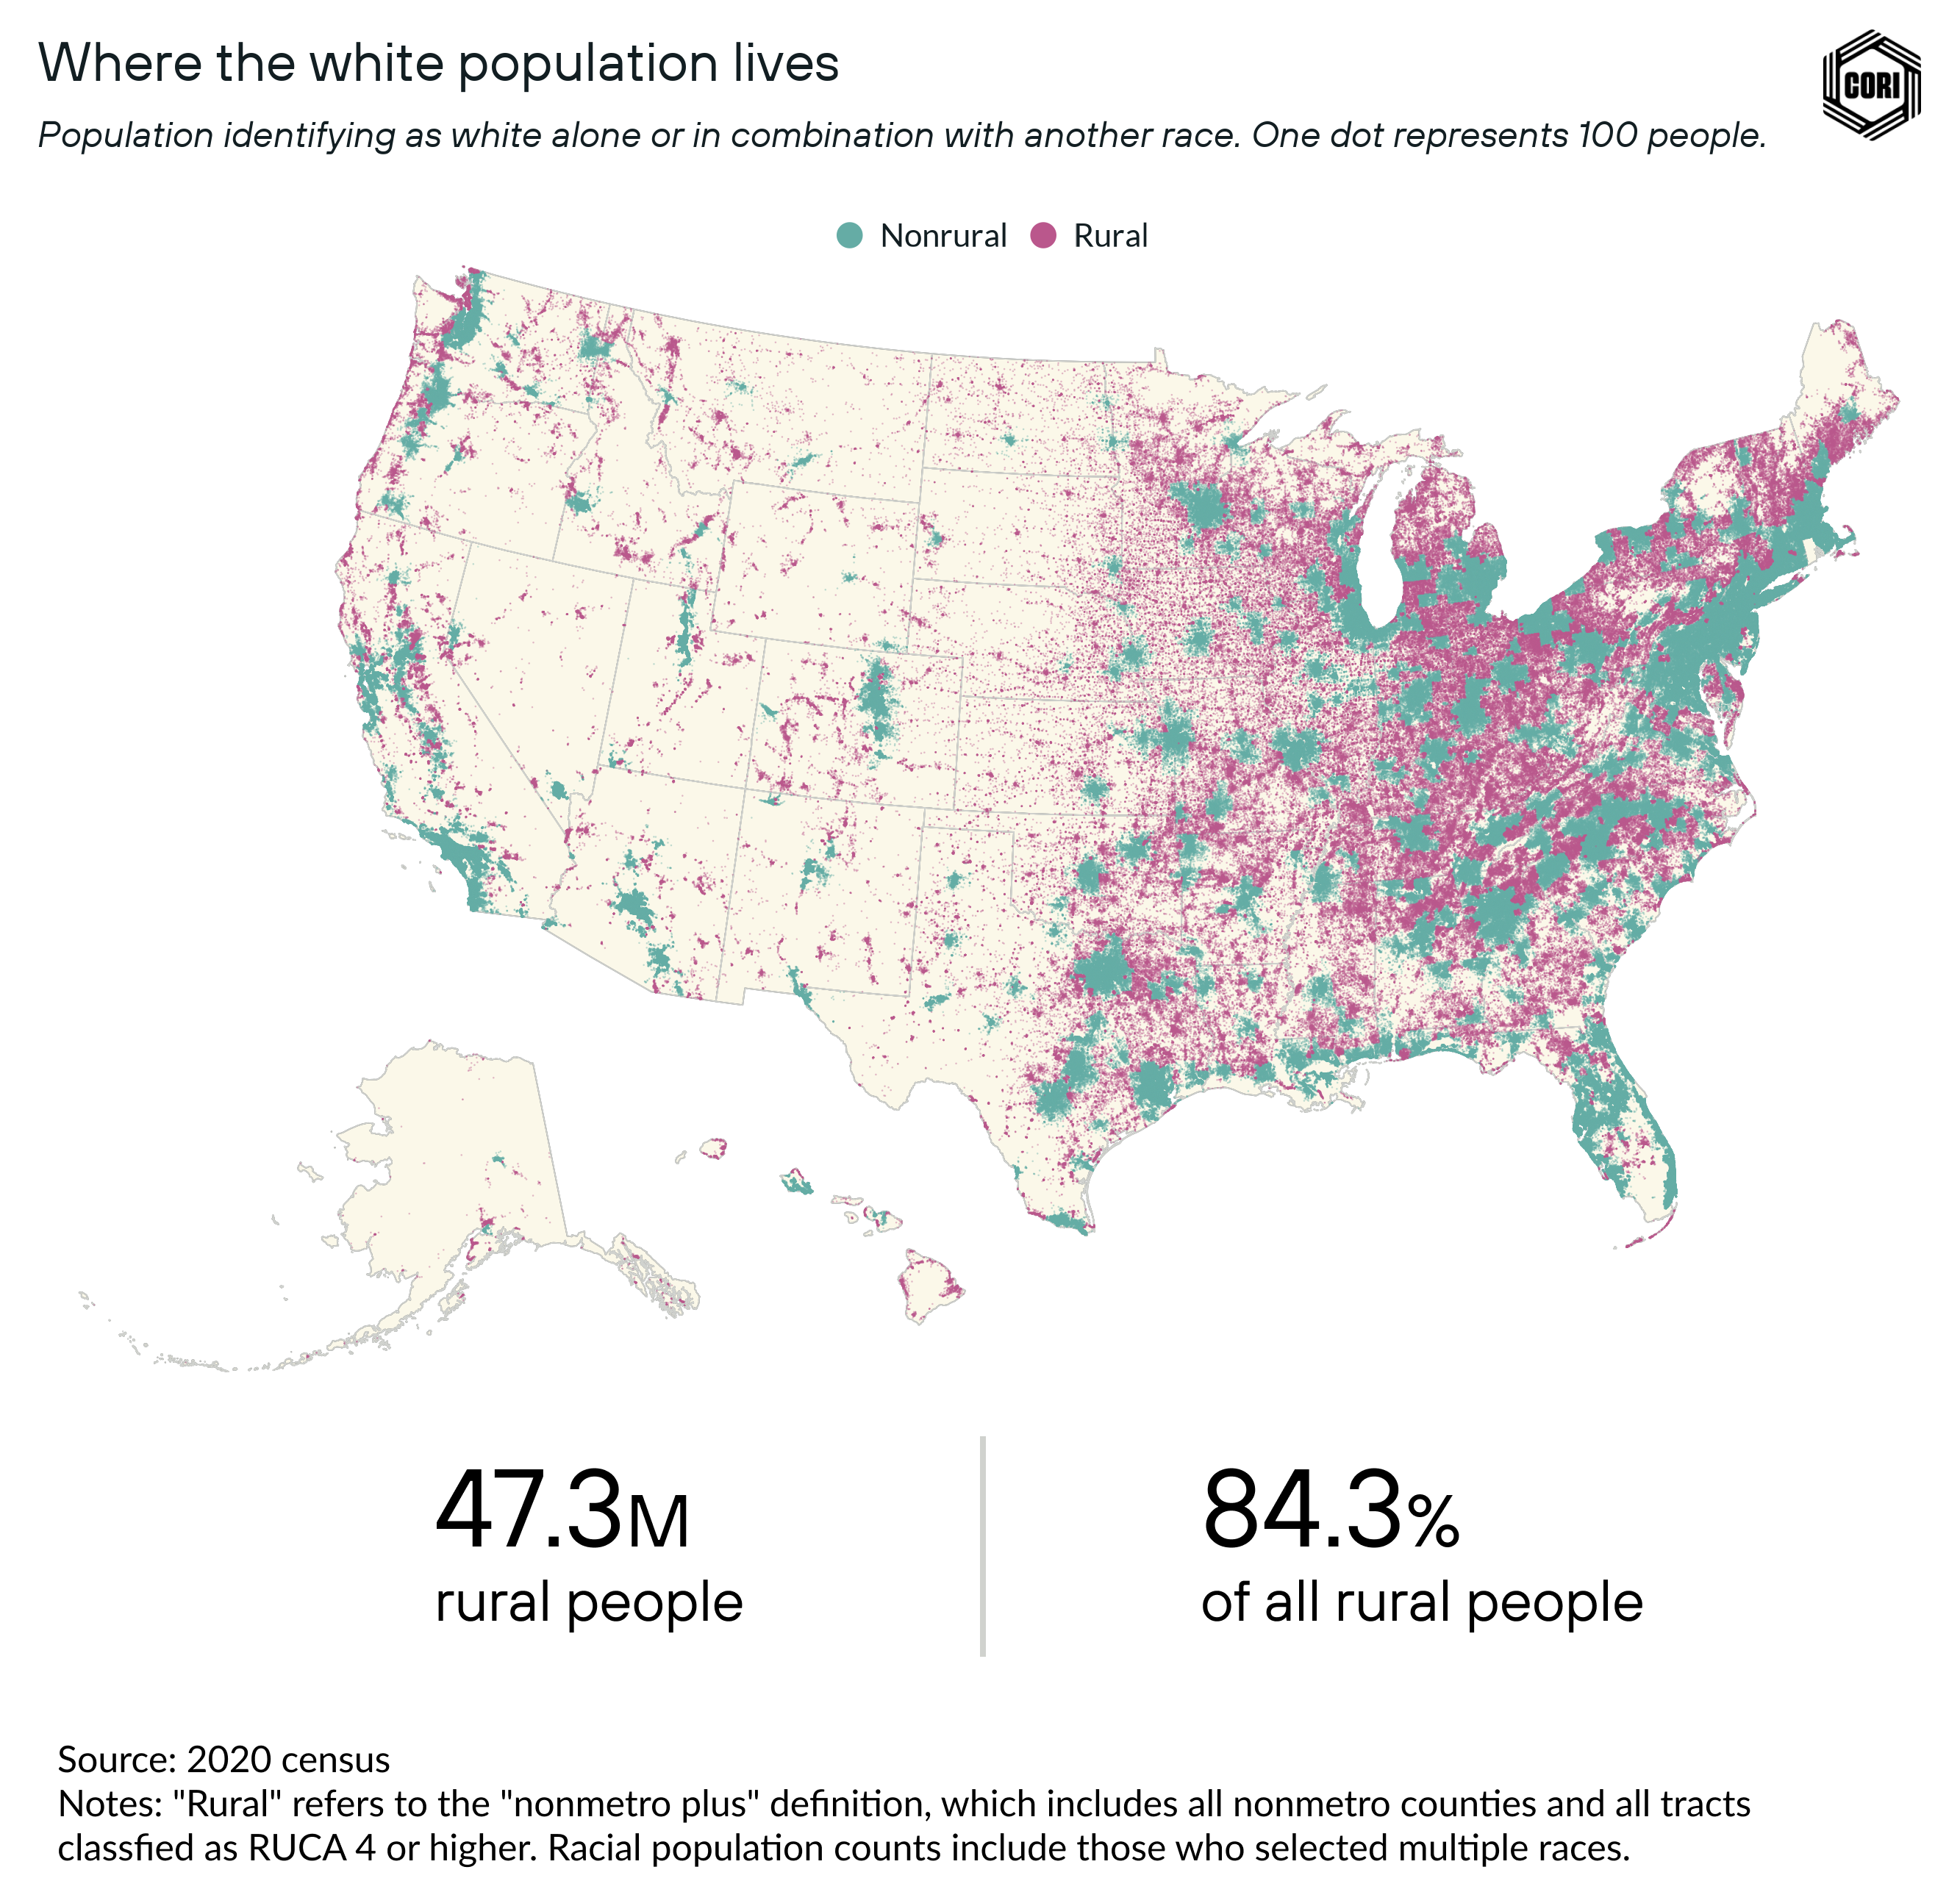
The rural white population accounts for 47.3 million people, or 84.3% of rural people as a whole (when considering those who identify as white alone or in combination with another race) (above). Although nationally, the white population makes up the majority of the rural population, the deep dives we’ve taken into other racial and ethnic groups in rural America shows that the reality is far more complex when taken to a more regional and local level.
How the U.S. census defines “white”
While all the other census racial and ethnic categories have shifted over time, the “white” category has remained quite consistent, as the category has been in its current form since 1850. Definitionally, the “white” category includes “A person having origins in any of the original peoples of Europe, the Middle East, or North Africa,” even as people from the Middle East may not perceive themselves (or be perceived by others) as white.
In our data, we tend to refer to the white population who selected “White” and not Hispanic or Latino. In our analysis for this piece, we use the term “white” when referring to those who identified as white in the census and are not Hispanic or Latino, unless specified otherwise.
Factors that have shaped the rural white population today
The geography of the rural white population was shaped by several centuries of government action and public policy that facilitated and subsidized the settlement of rural areas. First was the period of European colonization starting in the 17th century. This period produced the first European settlements and communities in the original 13 colonies, settlement of the Northwest Territory, the area of the upper midwest ranging from Ohio to Minnesota, and the settlement of the continental West.
During this time, while the white population became far more widespread across the country, government policies led to the forced removal of Native peoples off of their lands through war, violence, broken treaties, and public policy. For example, the Homestead Act of 1862 offered people 160 acres of land claimed by the federal government in exchange for living on and improving the land for five years, even while much of this land was taken directly from indigenous peoples.
The migrants and immigrants that benefited from these programs were almost exclusively white: Between 1864 and 1934, the program granted 246 million acres of land — 10% of the total US land area — at no cost to more than 1.5 million white families. In contrast, fewer than 10,000 Black families received land through the program.
Today, political representation in rural areas is still predominantly held by white officials: the current congress is the most diverse it has ever been, yet is still predominantly white, and similar trends persist at the state and local levels of government.
Going beyond the top-line census numbers on the rural white population
While white population growth has historically driven the growth and development of much of rural America, that population is now declining. This trend is consistent with declining white populations nationally, but the declines have been significantly more severe in rural areas. Between 2010 and 2020, the rural white population fell by 4.8%, nearly double the decline in the white population overall.
On the whole, rural America accounted for 37% of the national decline in the nation’s white population. This trend in large part stems from three major factors: an aging white rural population, rising mortality rates, and the trend of young white people moving out of rural places.
The white population in rural places is older than both the nonrural white population and rural people of color in aggregate: 36% of the rural white population is over the age of 55, but only 22% of rural people of color and 33% of nonrural white people fall into this age bracket (below).
Given that the young white population is also smaller, this means that, as the aging population dwindles, the rural white population overall will decline.
A compounding factor of the smaller young white population is that mortality rates among young white people living in rural America are rising. Life expectancy for white men and women between ages 25 and 64 living in rural America declined during the past decade, which can be attributed in part to the rise in opioid addiction and overdose deaths. Although the opioid crisis impacts rural people across all racial and ethnic groups, the white population is the only group for which overall mortality rates increased in recent years.
Finally, white population decline in rural America can be attributed to young people leaving rural areas to pursue economic, educational, and personal opportunities in metro areas. Oftentimes, students graduating high school may leave the area to attend college and end up settling elsewhere.
A new dataset on internal migration patterns shows the loss of young people from rural communities. For white millennials living in rural America at age 16, just 53% lived in their home region (defined by multi-county commuting zones) at age 26, compared to 67% of white millennials born in metro areas (below). Only rural Asian millennials were less likely to stay in the area where they grew up. Across all demographics, no more than 60% of rural millennials lived in their home region at age 26.
While age 26 is still young, this speaks to the shared challenge that many rural communities face to expand economic opportunities to retain more young people who are critical contributors to building sustainable and thriving rural communities.
Growth trends of the rural white population
The shrinking of the rural white population has been particularly stark over the past decade (below). The most severe declines have been in the Midwest and Northeast, which in 2020 had smaller white populations than in 2010. While the white population represents over 84% of the total rural population, falling white populations can have repercussions for all rural Americans, regardless of race.
Declining populations contribute to declining tax revenues, fewer public services, and business closures. Additionally, declining patient volumes reduce the financial viability of rural hospitals, and lead to closures that negatively affect the outcomes for everyone in rural places.
Programs and policies seeking to support rural communities with shrinking white populations need to take into account the specific local factors leading to population decline in that place — as 90% white communities will be facing different needs than those that are far more racially diverse.
![]()
Conclusion
The goal of this piece was to directly apply our good practices for advancing rural racial diversity to better understanding each racial and ethnic group that is included as a part of the U.S. census — “Black,” “Hispanic or Latino,” “American Indian and Alaska Native,” “Native Hawaiian and Pacific Islander,” “Asian,” and “white.” Through addressing a set of five guiding questions for each racial and ethnic group, we dug into the intricacies of census data to:
- Provide a focus on rural populations as a unique entity, rather than in comparison to urban areas and the nation as a whole.
- Show the value of adopting a regional approach to rural demographic data.
- Underscore why looking at rural demographic change over time matters when telling stories about rural diversity.
- Explore how delving into multiracial data is essential to avoid the undercounting of rural people.
- Explain how the census constructs racial and ethnic categories today and how these groupings have changed over time.
It is our hope that the stories in the Rural Aperture Project will serve as resources for researchers, practitioners, policymakers, and local leaders to turn back to over time when in need of guidance about what it means to define rural, understand data on rural demographics, and think critically about the ways that census data is used and the stories it tells.
![]()
About our partners
MDC: MDC is a nonprofit organization that partners with Southern leaders and communities to catalyze systemic change and allows more people to thrive, and offers research and analysis, community change and advisory services that can help communities create an “infrastructure of opportunity” — the aligned systems and supports that can boost everyone, particularly those who’ve been left behind, to higher rungs on the economic ladder.
Thrive Rural: A small group of Robert Wood Johnson Foundation grantees is working collaboratively towards a future where communities and Native nations across the rural United States are places where each and every person belongs, lives with dignity, and thrives. This work is one piece of that effort. For more information, please visit ThriveRural.org.
Robert Wood Johnson Foundation: The Robert Wood Johnson Foundation is committed to improving health and health equity in the U.S. In partnership with others, it is working to develop a Culture of Health rooted in equity that provides every individual with a fair and just opportunity to thrive, no matter who they are, where they live, or how much money they have.
![]()