Who lives in rural America? How data shapes (and misshapes) conceptions of diversity in rural America
Racial and ethnic diversity is one of the most commonly misunderstood aspects of rural America.
National media depictions of white farmers and ranchers in the West and Midwest, white coal miners in Appalachia, or the “white working class” living in rural communities reinforce the misconception that rural areas are homogeneously white. It is a misconception that ignores that 86 of the 100 most marginalized counties in the country are rural, 60 of which are located in Tribal lands or Southern regions with large Black populations. It is a misconception that renders invisible the 14 million Black, Hispanic or Latino, Asian, Native, and multiracial people who live in rural America (2020 census-nonmetro plus).
![]() It is a misconception that holds significant consequences.
It is a misconception that holds significant consequences.
Misunderstandings of diversity in rural America can inhibit efforts to support programming and policies designed to increase the ability of rural communities to thrive. For rural communities to thrive, national, state, and local leaders need to take efforts to systematically address racial and ethnic inequities that limit the freedom, safety, and opportunity of rural people of color.
There is an imperative to better understand who lives in rural America today. In just the past few years, billions of public and private dollars have been committed to building a more equitable economy. The Infrastructure Investment and Jobs Act (IIJA), the CHIPS Act, and the Inflation Reduction Act (IRA) have committed hundreds of billions of dollars that will be invested by federal agencies and state and local governments in healthcare, housing, energy, and economic development.
As part of these efforts, the Biden administration has ordered federal agencies to prioritize advancing racial equity in the design of these programs and the distribution of resources. Similarly, companies and philanthropy have made racial equity commitments of more than $200 billion. With these public and private commitments, hundreds of billions of dollars will be invested in the coming years with a specific focus on addressing racial equity.
Yet, if these historic investments are not informed by an accurate understanding of rural demographics and how these communities have evolved over time in response to government policies and settler-influenced power shifts, then we risk excluding rural communities and people of color from the critical resources that are needed to strengthen communities and economies that serve everyone.
In Part 1 of the second story in our Rural Aperture Project, a multi-story series funded by the Robert Wood Johnson Foundation’s Thrive Rural initiative, we seek to explain how and why such flawed conceptions of rural America exist.
In the accompanying second part, we strive to illustrate the stories of the different demographic groups who make up rural America — where they are, how they came to be there, and how they have changed in the past decade — even as we acknowledge that no story can capture the experiences of all the people in a demographic group.
Acknowledgements
This project would not have been possible without the valuable insight, critique, and feedback from our collaborators who are embedded within a diverse array of communities, organizations, and institutions across the country, and helped to ground-truth our narrative framing and data. Thank you to AAPI Data, Center for Sustainable Development at the Brookings Institution, MDC, Oweesta, Partners for Rural Transformation, and Rural Community Assistance Corporation for their wisdom and support.
![]()
Key takeaways
In Part 1 of "Who lives in rural America?" we will discuss five ways to look at data that can lead to misconceptions about rural demographics, along with six recommendations for using data effectively to advance rural racial equity.
How data can lead to misconceptions about rural demographics:
1. Defining diverse places based on national and urban benchmarks
2. Treating rural America as a single region
3. Considering rural demographics at a single point in time
4. Using the wrong definition of “rural”
5. Taking census data at face value
Recommendations for using data effectively to advance rural racial equity:
1. Focus on rural populations as a unique entity, not on comparisons with urban areas and the country as a whole
2. Adopt a regional approach when using rural demographic data
3. Pay attention to demographic changes over time
4. Account for who is and is not included in different rural definitions
5. Go beyond the top-line numbers
6. Recognize that power and privilege often trump populations numbers in rural areas
![]()
Understanding terms and definitions
Race and ethnicity
Race and ethnicity are central components of the U.S. Census Bureau’s demographic data, and also central components to many peoples’ identity. The census itself refers to race as “a person’s self-identification with one or more social groups,” and ethnicity as “determin[ing] whether a person is of Hispanic origin or not.”
More holistically, race is a socially constructed system that encompasses the categories assigned to demographic groups, often based on observable physical characteristics; while ethnicity refers to the social characteristics that people have in common, such as language, religion, regional background, and culture. Discussions on defining race are complex and multifaceted, and more resources can be found here.
Throughout this piece, when we say “diversity,” we are referring to racial and ethnic diversity.
Equity
Equity refers to the idea of treating people fairly, even if that means not treating every person, group, or community exactly the same. Taking on an equity lens “seeks to render justice by deeply considering structural factors that benefit some social groups or communities and harm others.”
Rural
As depicted in our first story on rural definitions, rural can be a challenging term to define. In the context of this story, we use the nonmetropolitan definition to define rural when we only have access to county-level data, and we refer to these as “nonmetro” areas.
When we have access to census tract-level data, we use a combination of the nonmetro definition and tracts within metro counties that are rural in character (based on the RUCA classification). We refer to these as “nonmetro plus” areas to indicate that we are including beyond just the nonmetro definition.
Unless otherwise noted, we use the “nonmetro plus” definition in this story when referring to rural populations.
![]()
How can data lead to misconceptions about rural America?
Data can be a powerful tool for bringing visibility to the presence, experiences, and historical conditions of people in rural America.
At the same time, we must be careful about how we look at data. The ways in which data is collected, organized, and framed significantly impacts the story that data tells. The same set of data, seen through two different lenses, can result in vastly different narratives.
Indeed, the lenses through which we have examined rural demographic data have largely contributed to our misconceptions of rural America.
1. Defining diverse places based on national and urban benchmarks
National demographic data is often used as a benchmark for comparing communities to target economic and social programs aimed at advancing racial equity. When national demographic data is cited by news outlets and reports, it shapes the national narrative about race and ethnicity — and about what it means to be considered “diverse.”
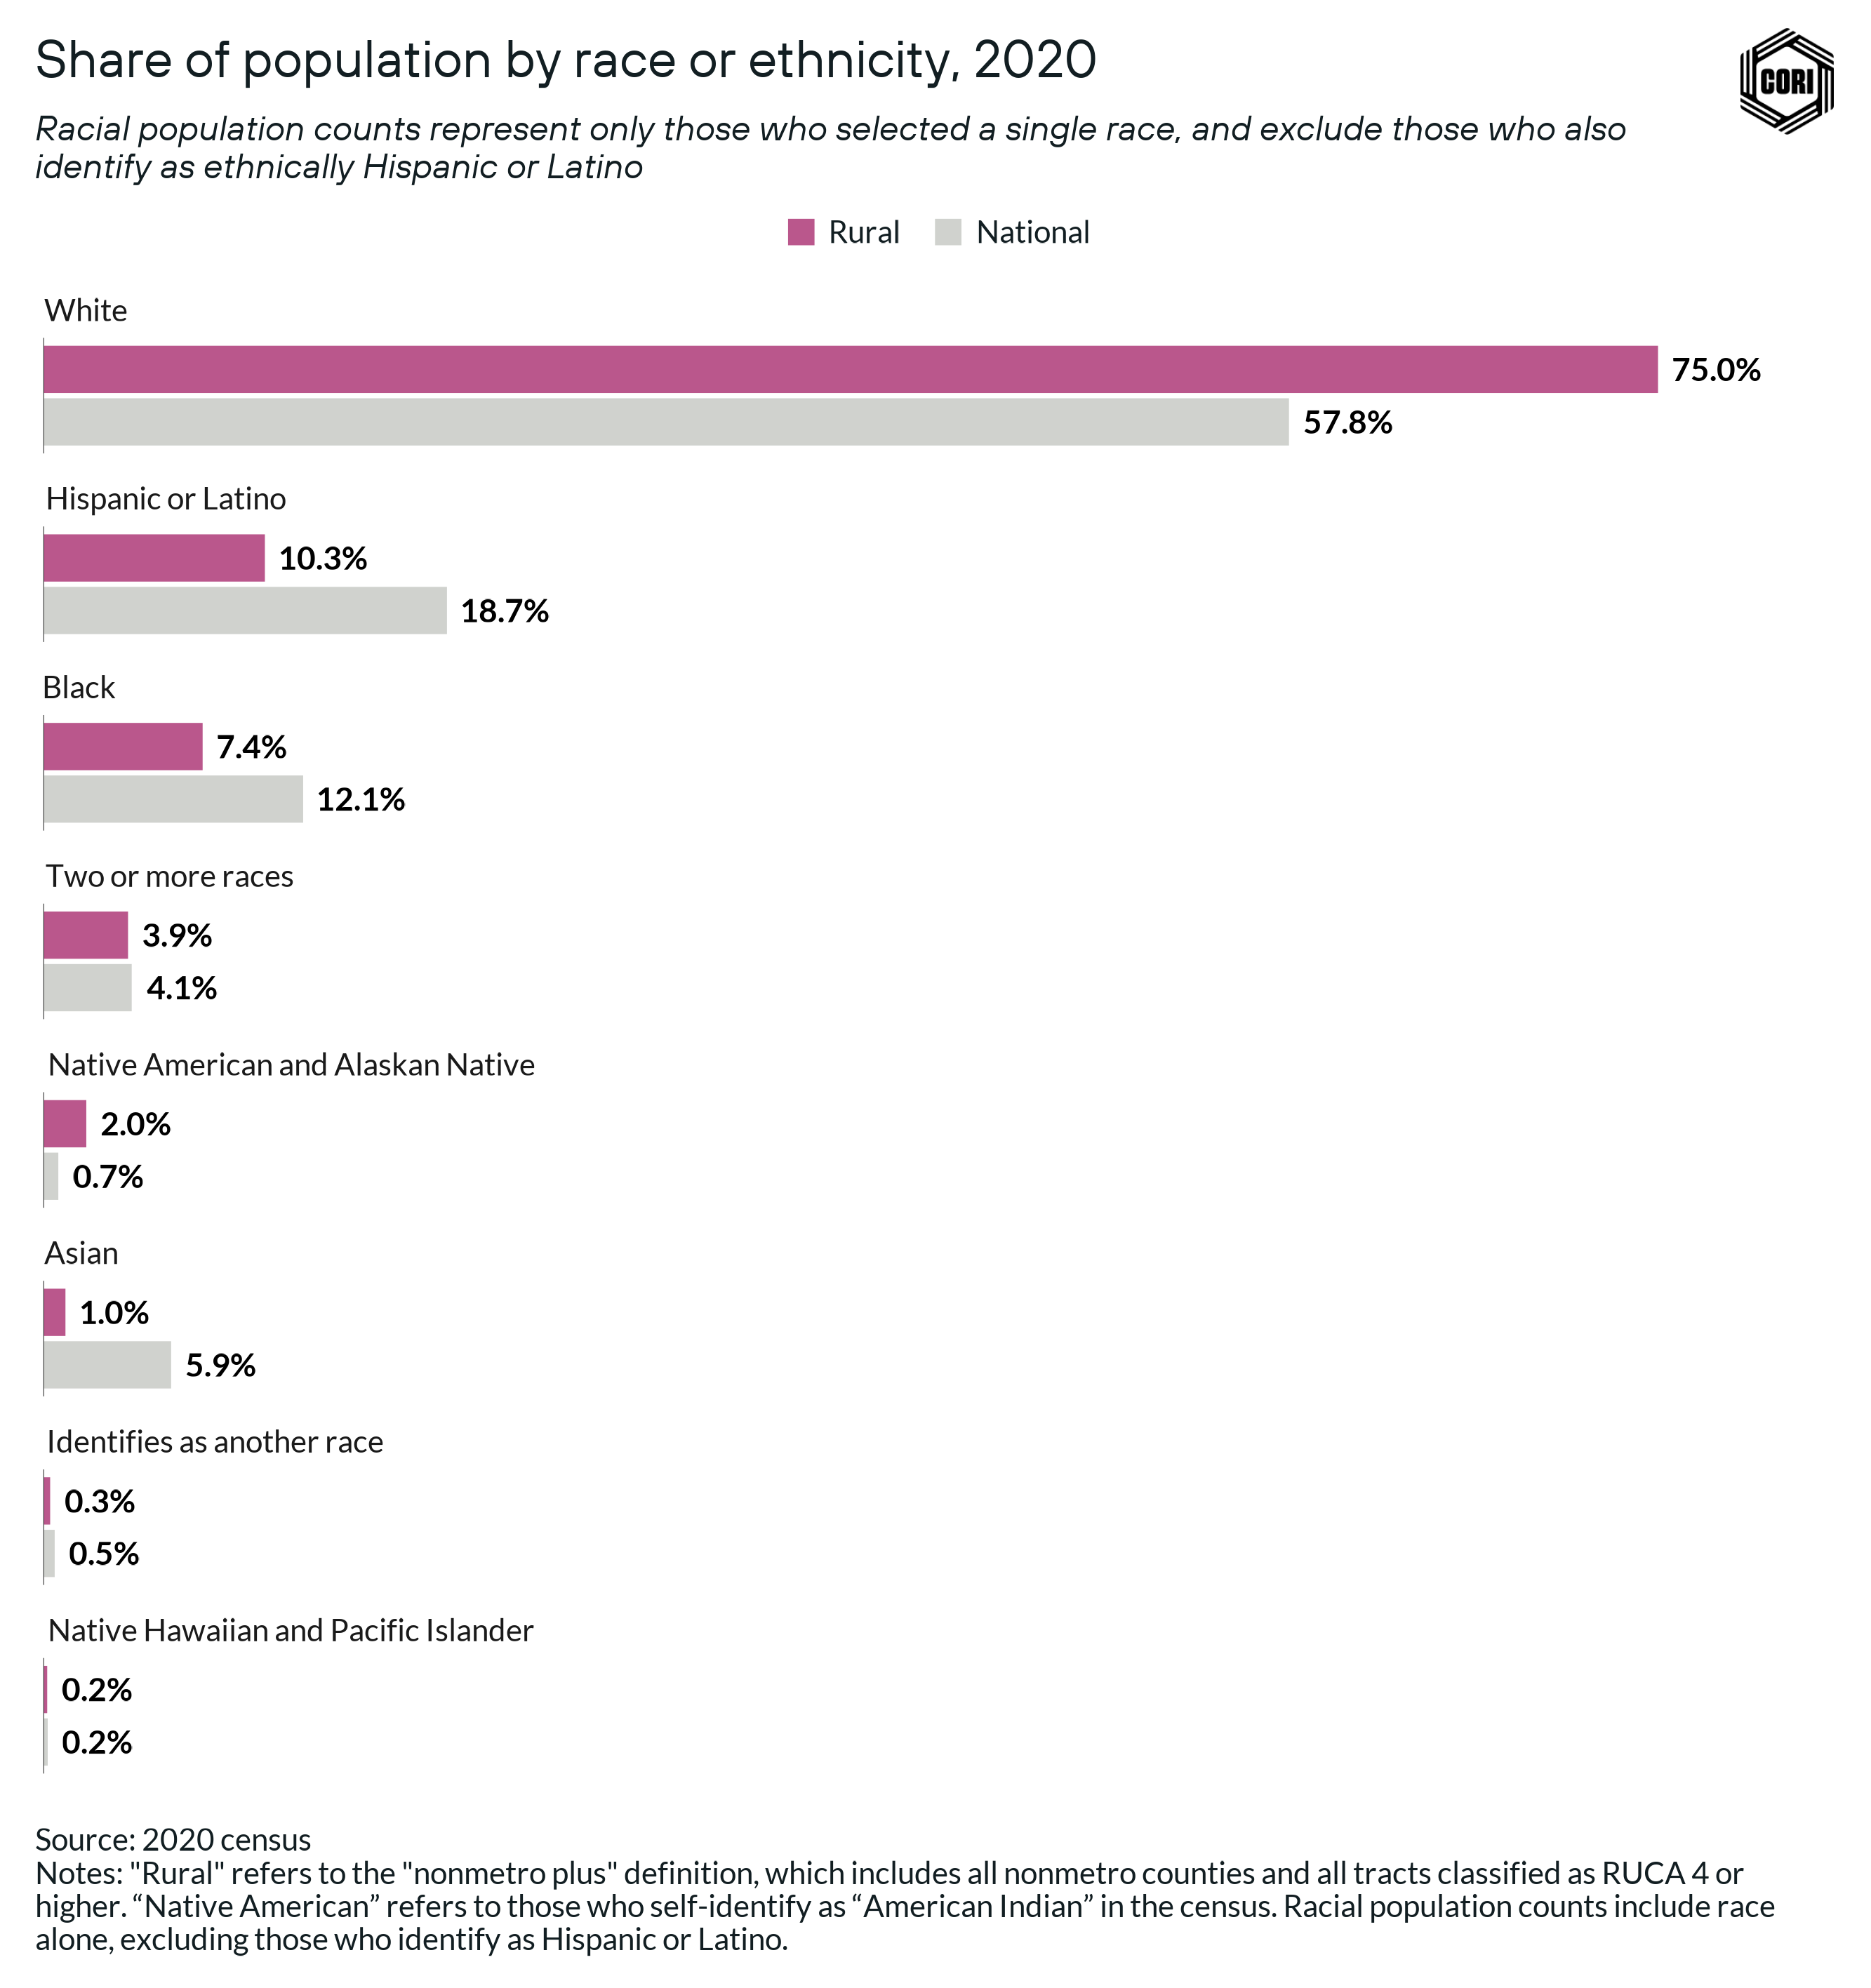
National census data shows that the white (not Hispanic or Latino) population made up 58% of the national population in 2020, compared to 75% in rural America (below). National data is often used to define which places are considered to be racially “diverse” or “nondiverse,” which renders rural America as relatively homogenous and white.
![]()
Why do rural population figures vary?
As described in our first story, there are often varying numbers that are used when accounting for different peoples and places. One reason relates to the rural definition — whether it is the census, nonmetro, nonmetro plus, or another definition entirely. Another reason is about how the population counts are actually being framed in the census. Based on basic math, one would make us assume that all percentages of populations, when compared, should add up to 100%. But when it comes to population data, this is not always the case — and here are a few guiding principles to help understand why:
If we are comparing racial percentages to represent part of a whole population, we use census data that represents “race alone, not Hispanic or Latino.”
This is because when representing an entire population, we need to ensure that the categories are mutually exclusive. This is the case in the graphic above where, for example, we show that those who identify as white alone account for 75% of rural America.
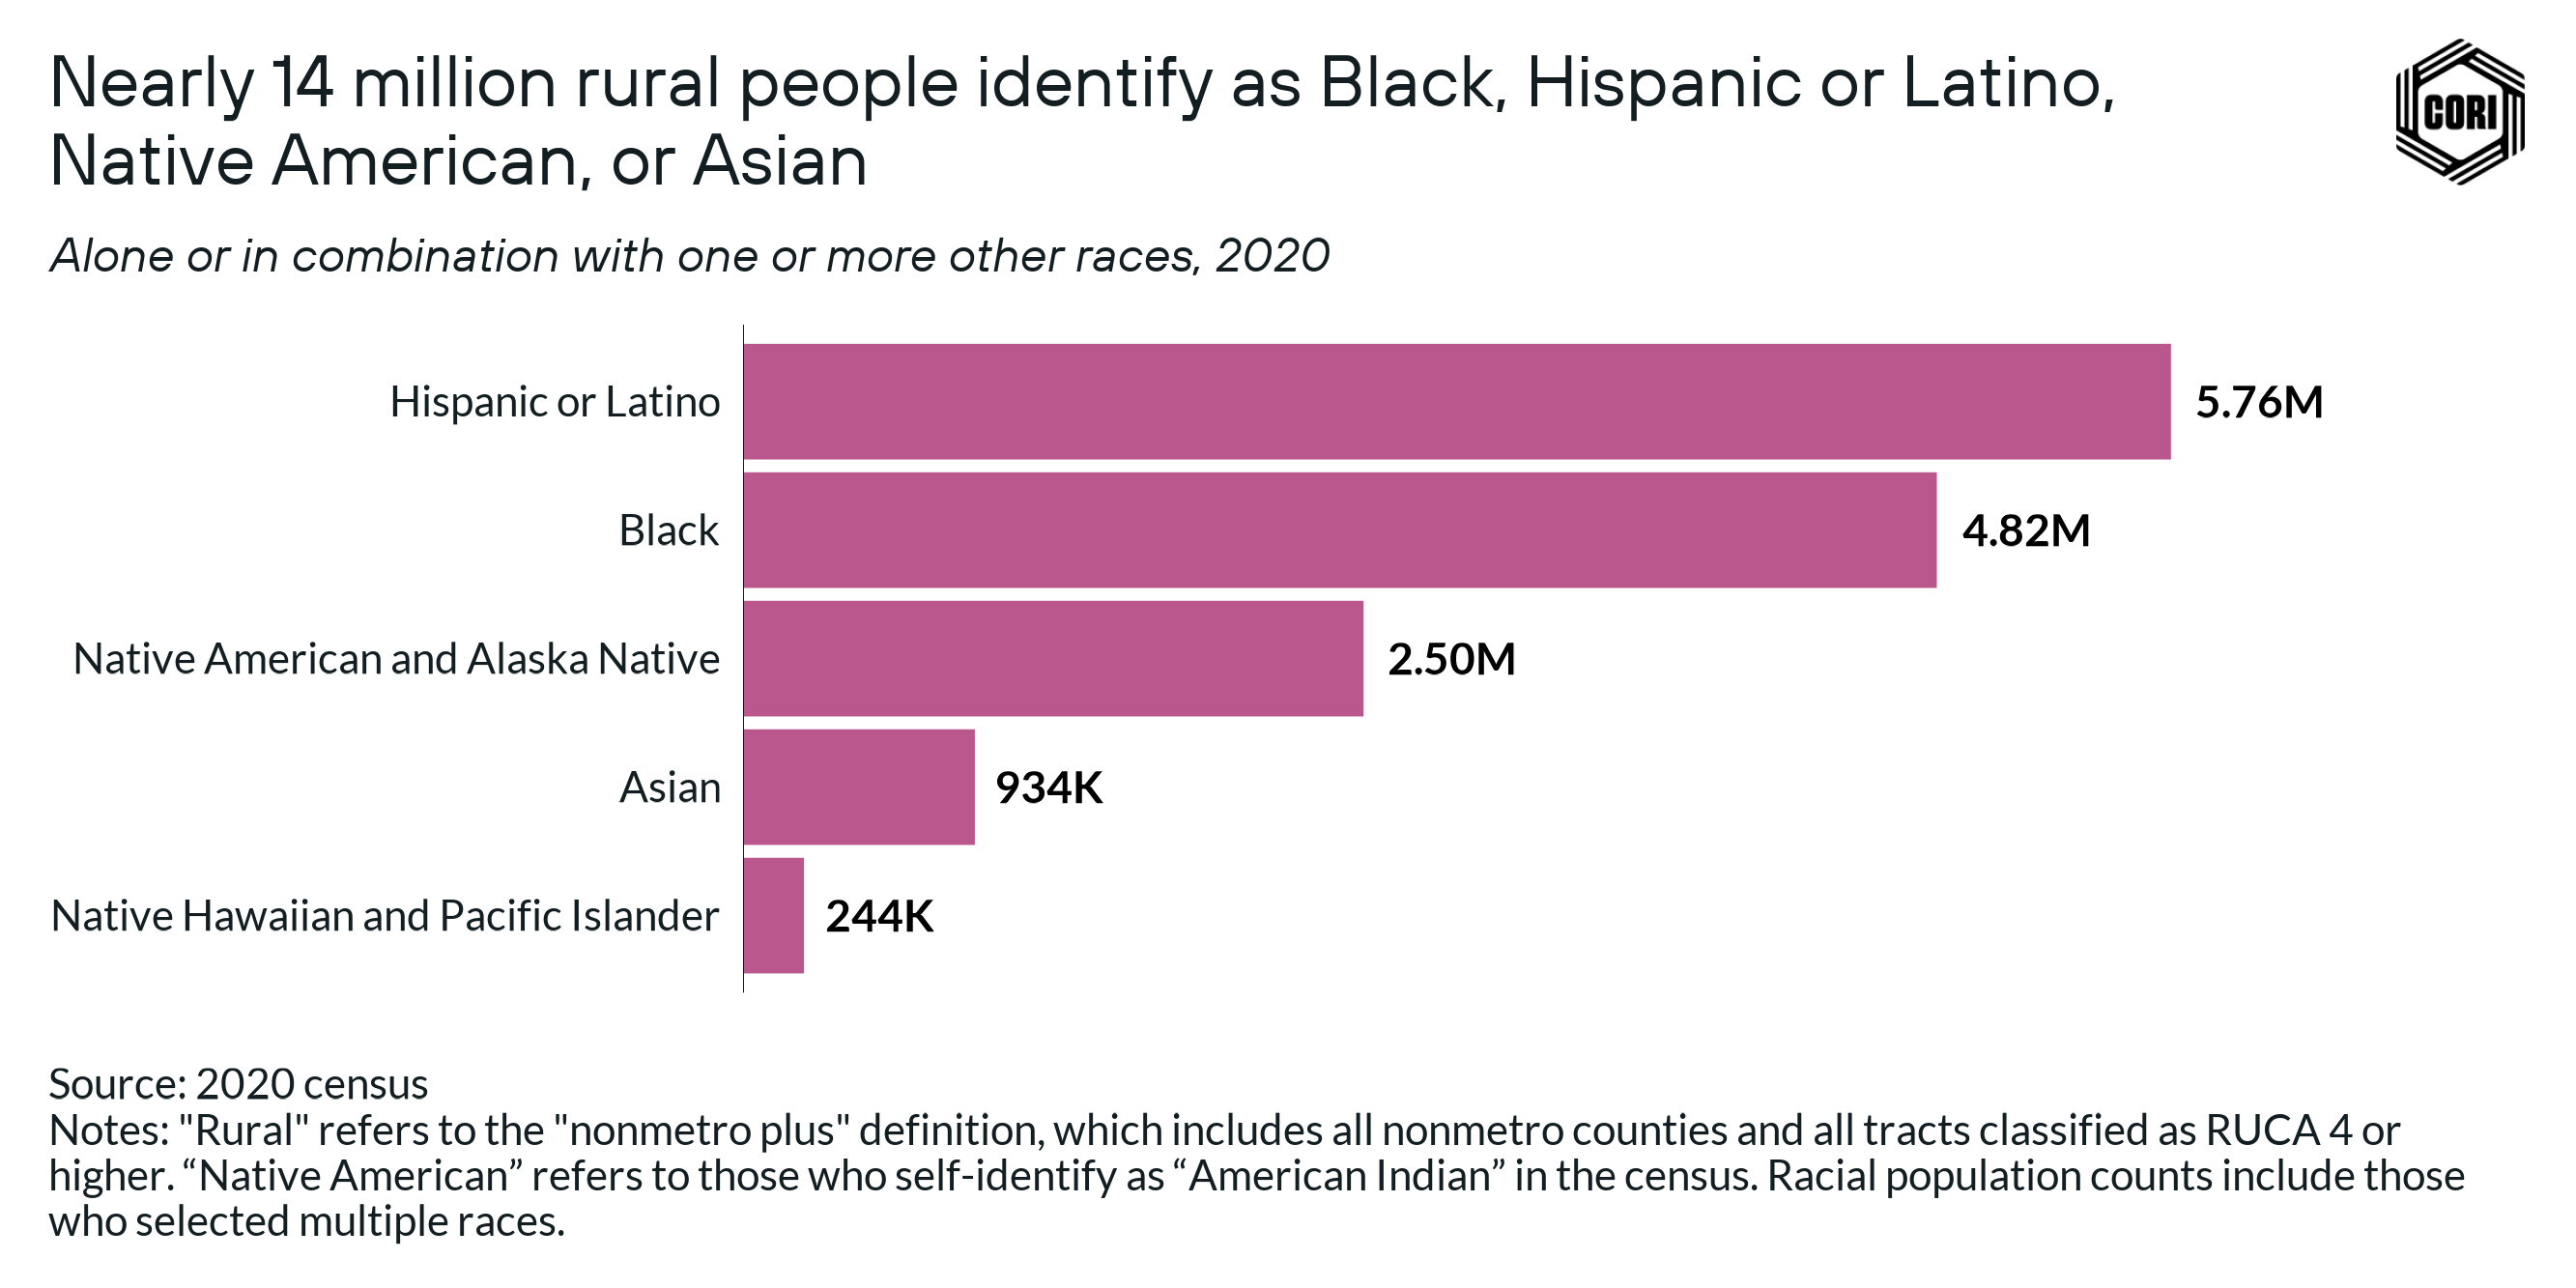
When we want to ensure broader representation of anyone who identifies as a particular race, we use census data that represents “race alone or in combination with another race.” This enables us to paint a more inclusive picture of individuals’ racial identities on a population level.
When compared, these percentages may not add up to 100% because they are not intended to represent one singular picture of a population, and can lead to people being double counted across different races. This is the case of many visualizations in Part 2 of “Who lives in rural America?” There, for example, we show that over 84% of rural people identify as white, including those who are white and multiracial.
![]()
However, this data does not take into account the large population of Black, Hispanic or Latino, Native, and Asian people who live in rural America today. In 2020, there were nearly 14 million rural people identifying as Black, Hispanic or Latino, Native, Asian, or multiracial (below), a population larger than New York City and Los Angeles combined (2020 census).
Cities are also held up as a model for understanding racial and ethnic diversity in America, as diversity has long been a defining feature of cities, and ideas of urban diversity tend to be shaped by large metro areas with at least 1 million people. Using the largest metro areas in the country, like New York, Los Angeles, Atlanta, Chicago, and San Francisco, as the threshold for racial/ethnic diversity can create a sense that there are two types of places: diverse places that look like the biggest metros in the country, and non-diverse places that are homogeneously white. When juxtaposed with rural places, this urban lens contributes to the picture of a more homogenous, white rural America.
A common way that local diversity is measured is by looking at the mix of racial and ethnic groups in an area. In 2020, more than 40% of people living in a large metro area lived in a county where no one racial or ethnic group made up the majority of the population. Those living in the urban core were even more likely to live in an area where neither white nor non-white people represented a majority (2020 census-CDC). On the other hand, in 2020, 90% of rural Americans lived in a county with a white majority population (2020 census-nonmetro). On the surface, this way of looking at diversity reinforces the narrative around a lack of racial and ethnic diversity in rural America.
Yet, this framing overlooks two realities that are different between rural and urban areas.
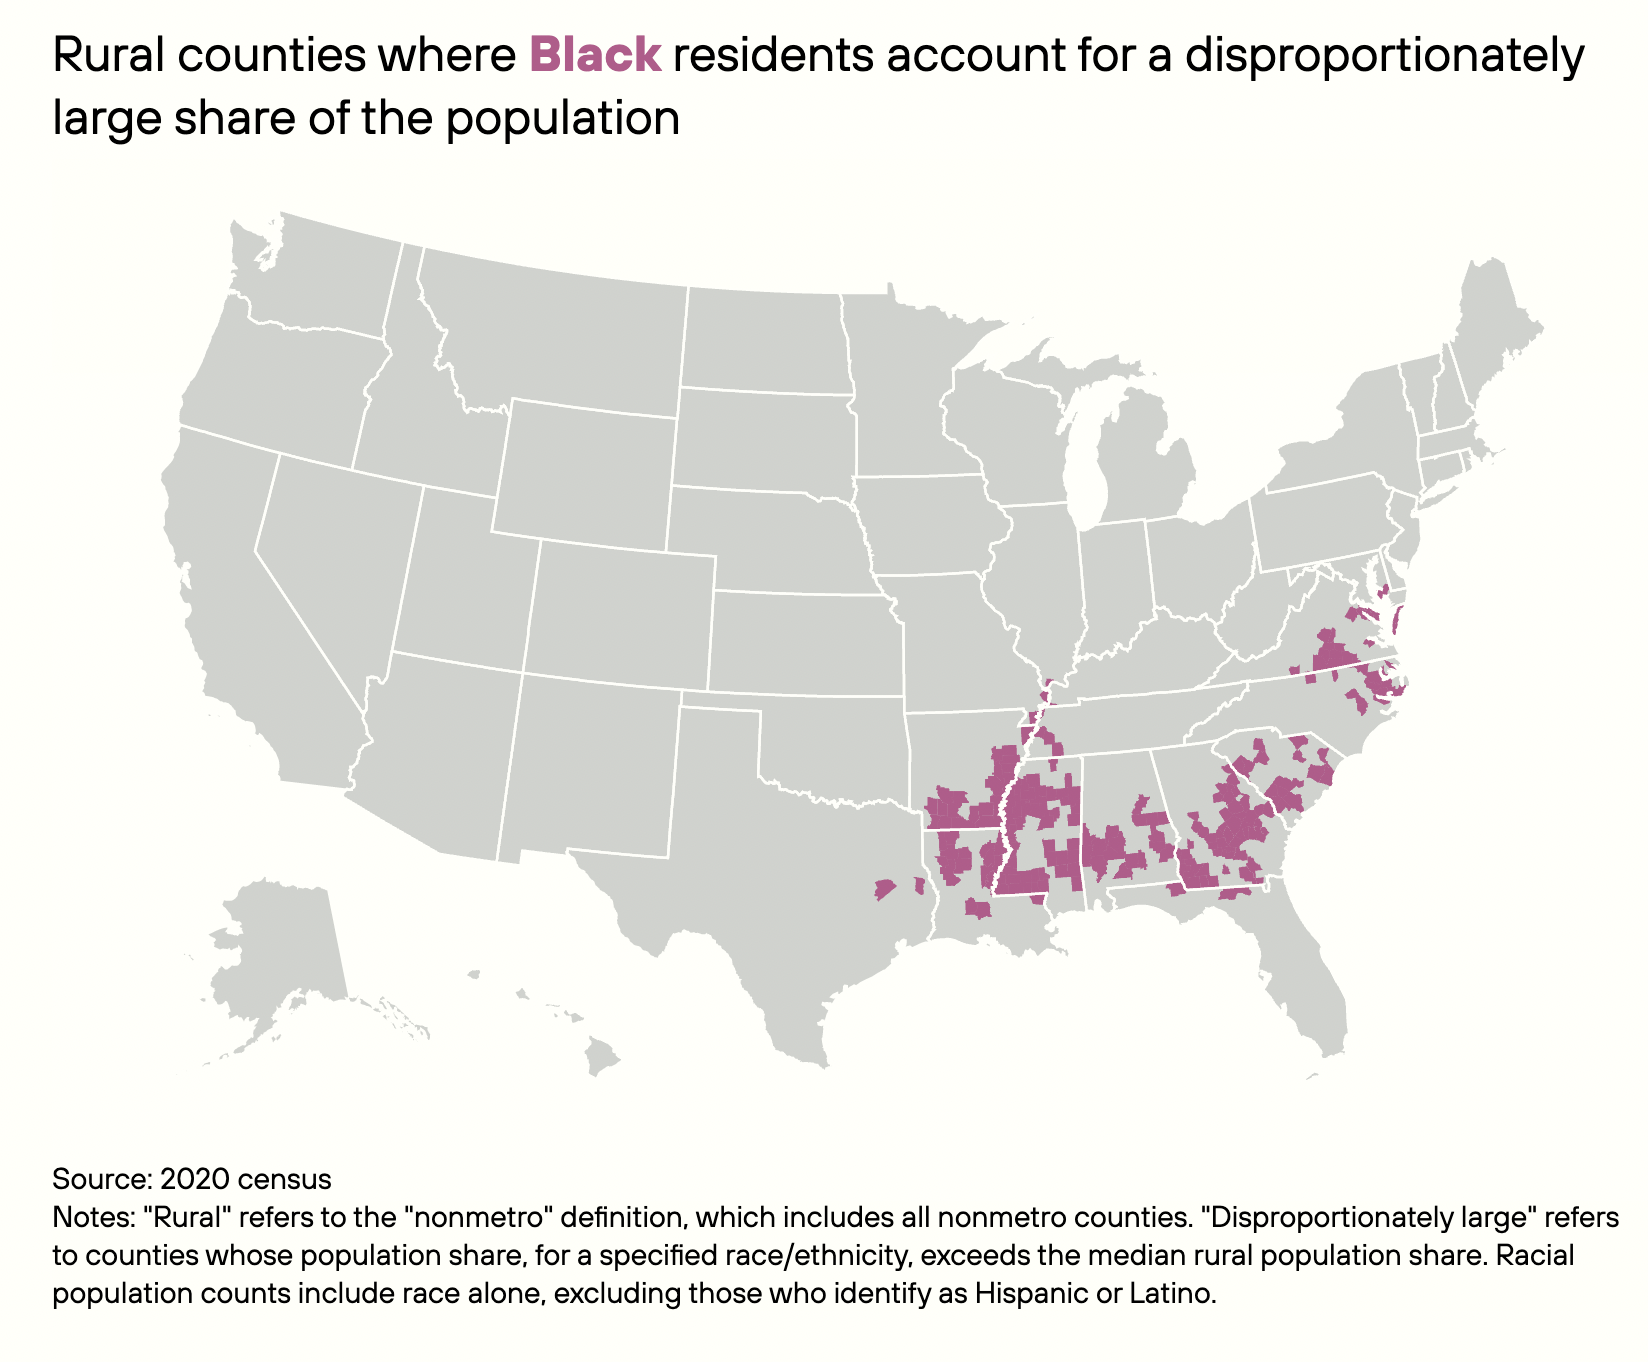
First, more than half of rural Black, Hispanic and Latino, and Native people live in counties where they make up a disproportionately large percentage of the local population.
The rural Black population accounts for only 8% of the total rural population, but more than half of rural Black people live in a county where the local Black population is greater than 30%.
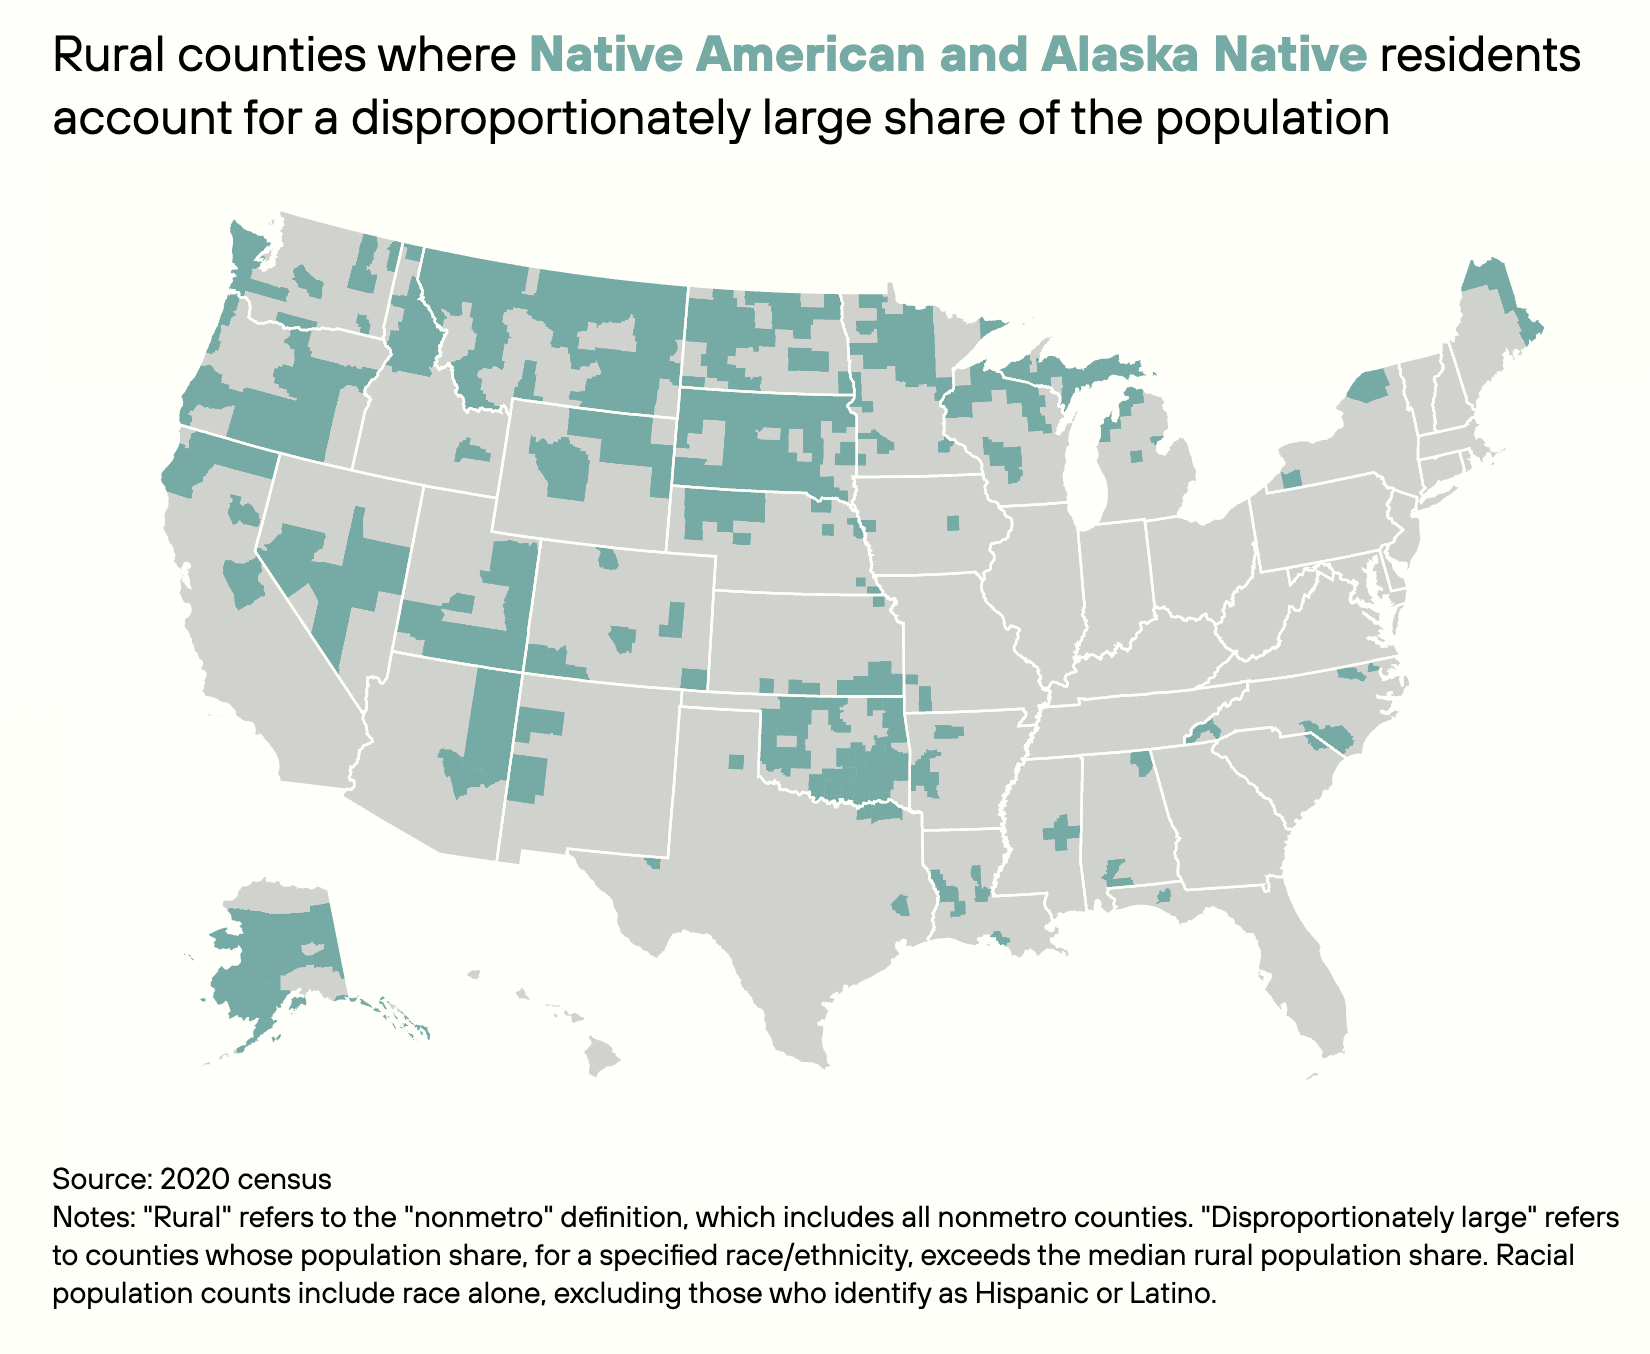
The Native American and Alaskan Native populations account for only 2% of the total rural population, but more than half of Native American and Alaska Native rural people live in a community where the local Native American and Alaska Native population is greater than 18%.
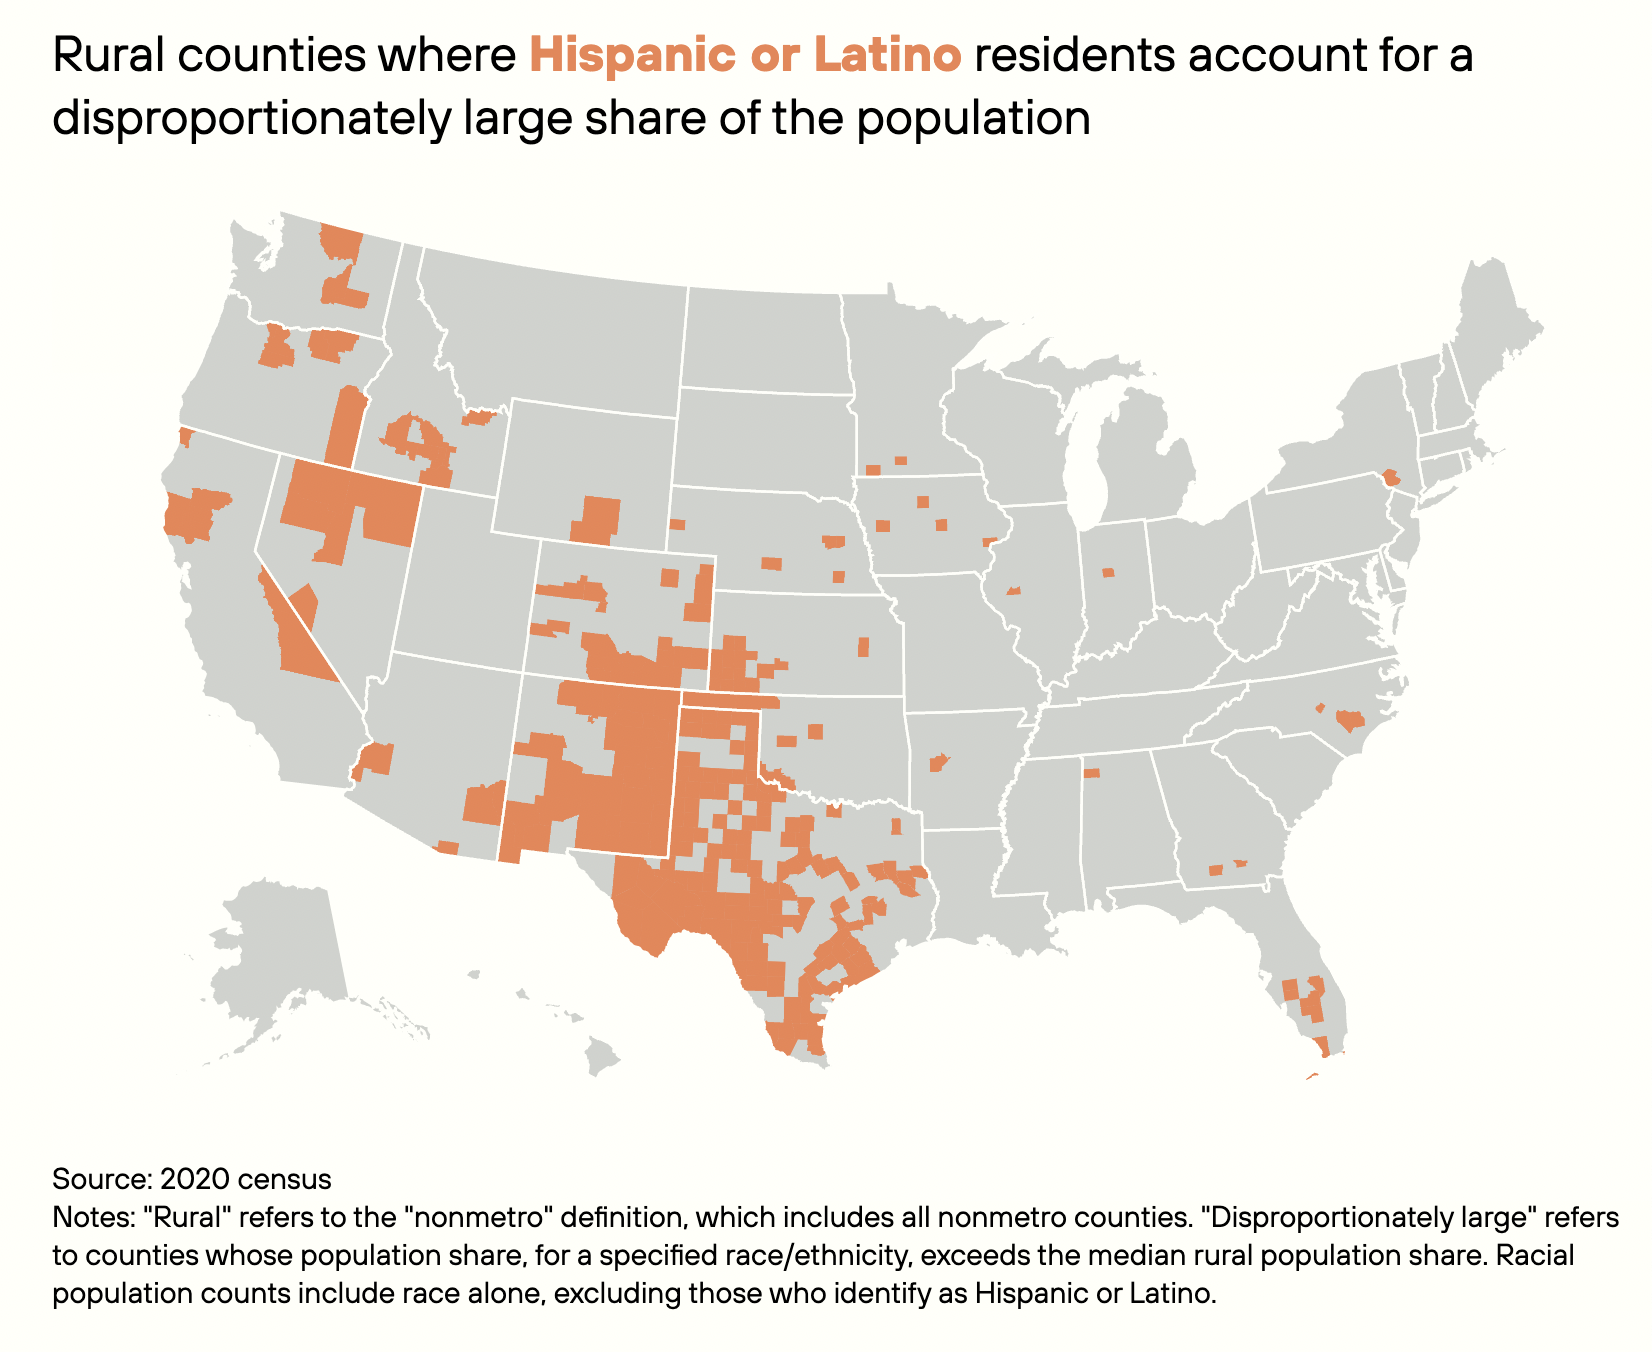
The rural Hispanic population accounts for 9% of the total rural population, but more than half of rural Hispanic or Latino people live in a county that is 18% Hispanic or Latino.
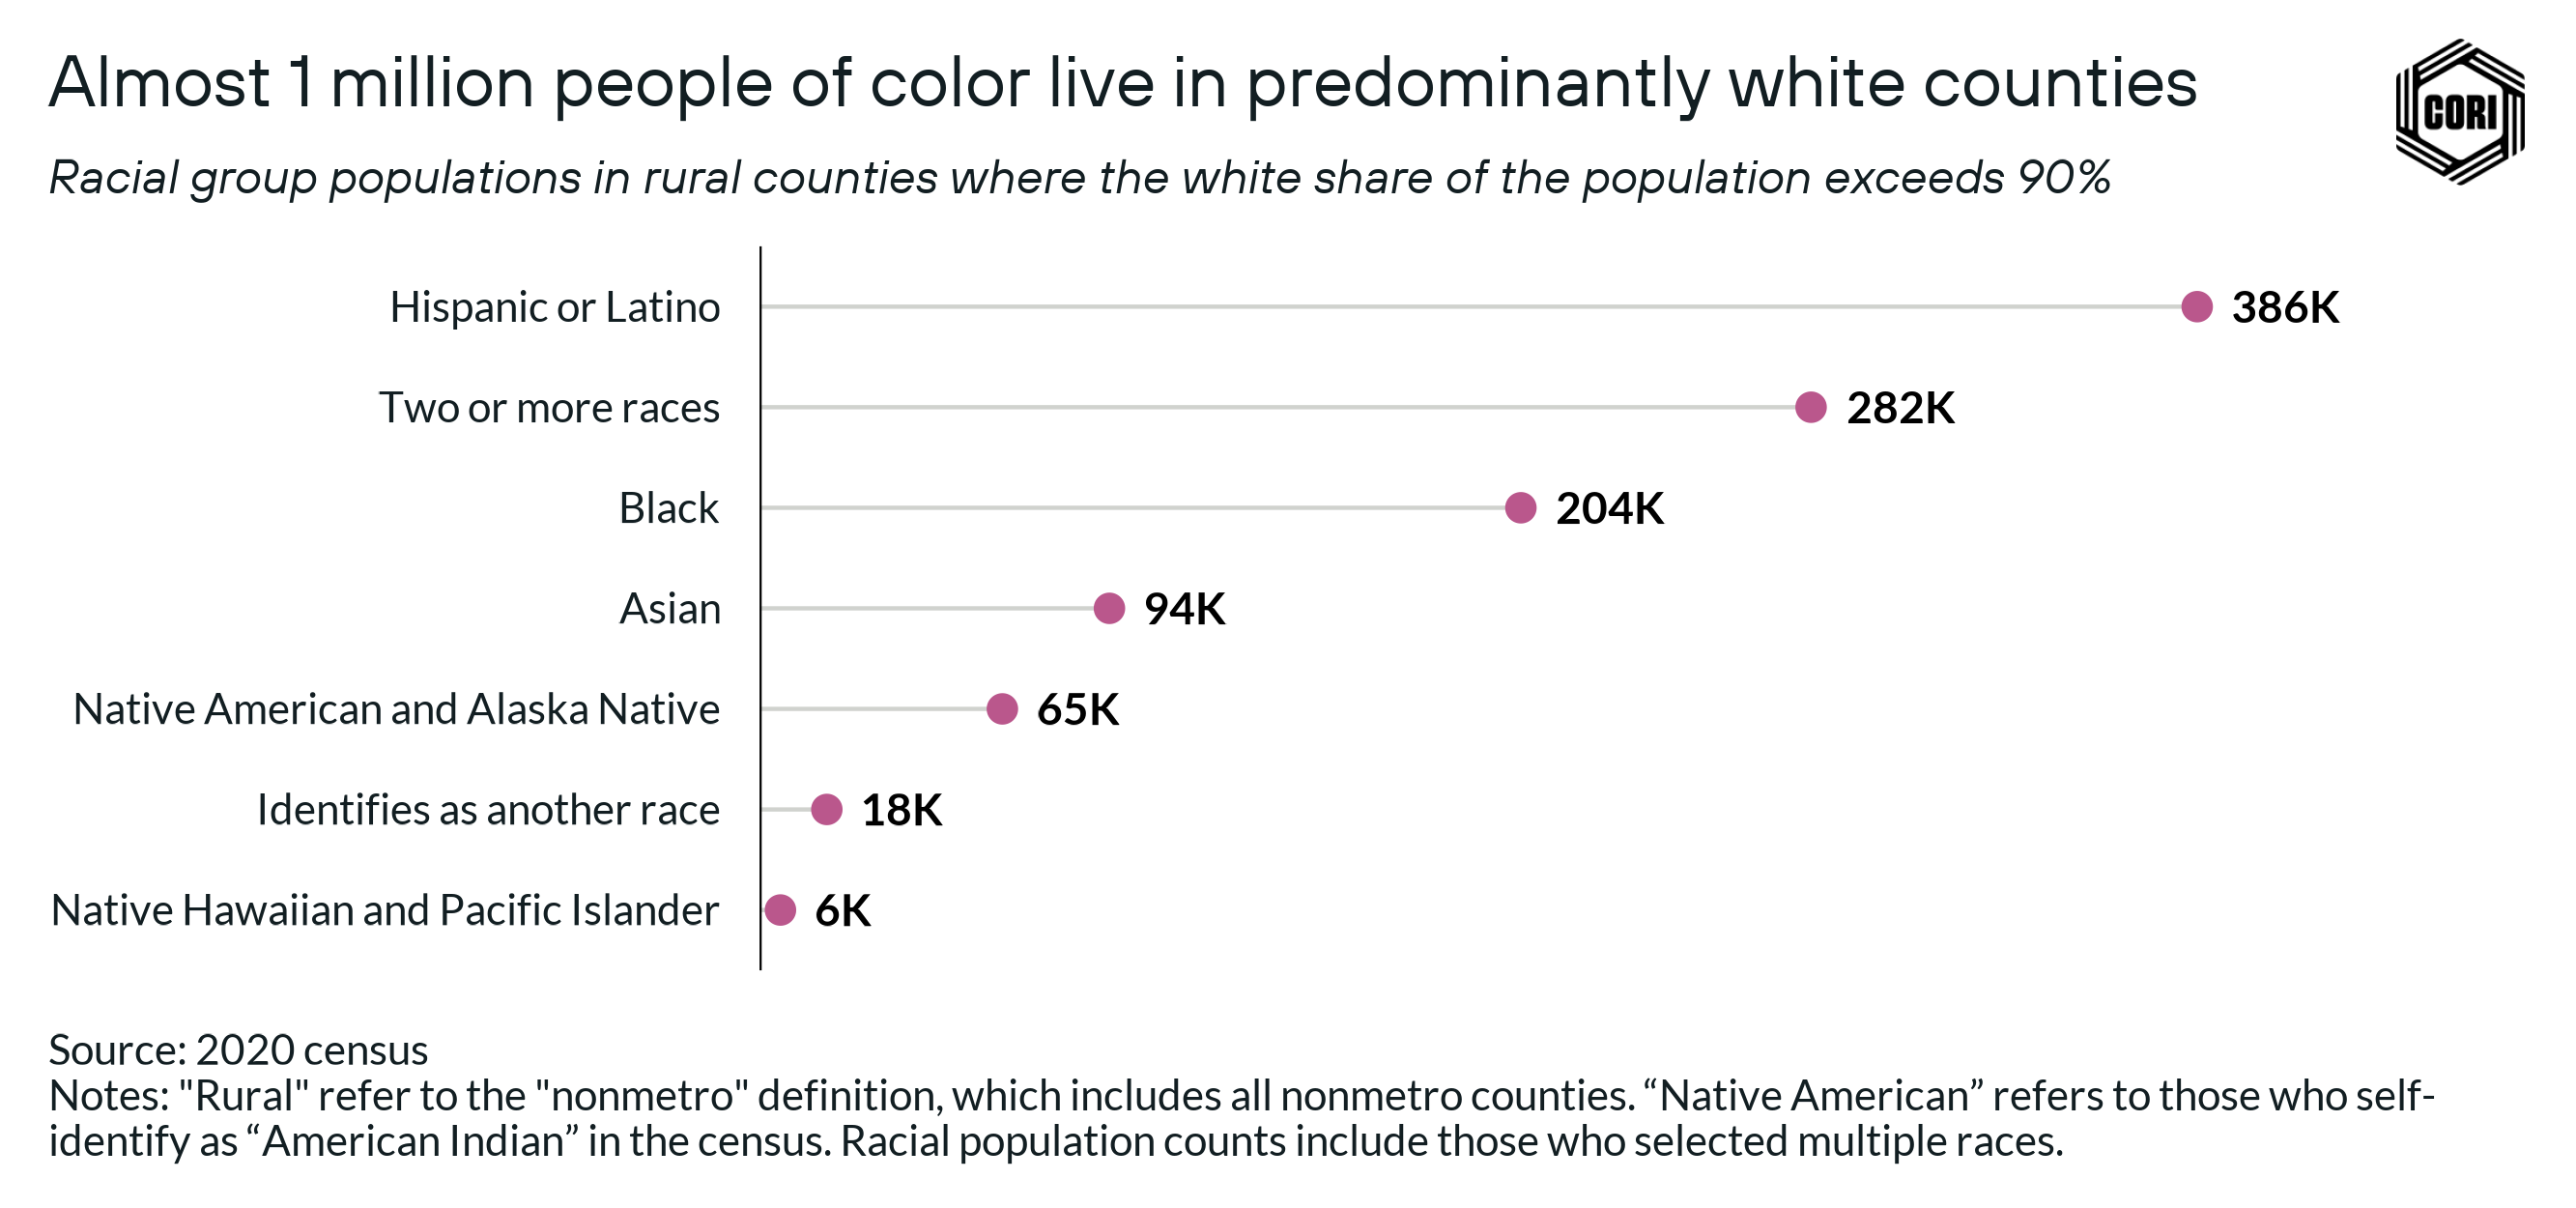
Second, the rural Black, Asian, Hispanic or Latino, and Native populations in majority-white counties make up a small portion of the population in these counties, and are often overlooked (below). Nearly 1 million people of color live in predominantly white areas, representing 8% of the total non-white rural population.
Overall, rural Black, Hispanic or Latino, Asian, and Native people are 21 times more likely to live in a county that is predominantly white compared to people living in metro areas. Non-white people living in these areas are often made invisible by their small numbers, both in the national conversation about race and ethnicity, and even within the communities where they live.
Rural people of color live in a wide array of demographic contexts, which contributes to a distorted understanding of rural America when national and urban benchmarks are used to define diversity. Understanding these realities is critical to incorporating rural areas into a broader understanding of race and ethnicity in America.
![]()
2. Treating rural America as a single region
While we don’t treat New York, Atlanta, San Francisco, New Orleans, and Washington, D.C. as belonging to a single “region” of metropolises, we often treat rural America — including Appalachia, the Mississippi Delta, the Ozarks, the Oklahoma Panhandle, and Native reservations — as such. This sweeping (and erroneous) oversimplification ignores the dramatic diversity of experiences among rural people.
Indeed, rural diversity is far greater at the local and regional level as compared to rural areas nationally. Explore the interactive map below to see this racial and ethnic diversity on display in communities across the U.S.
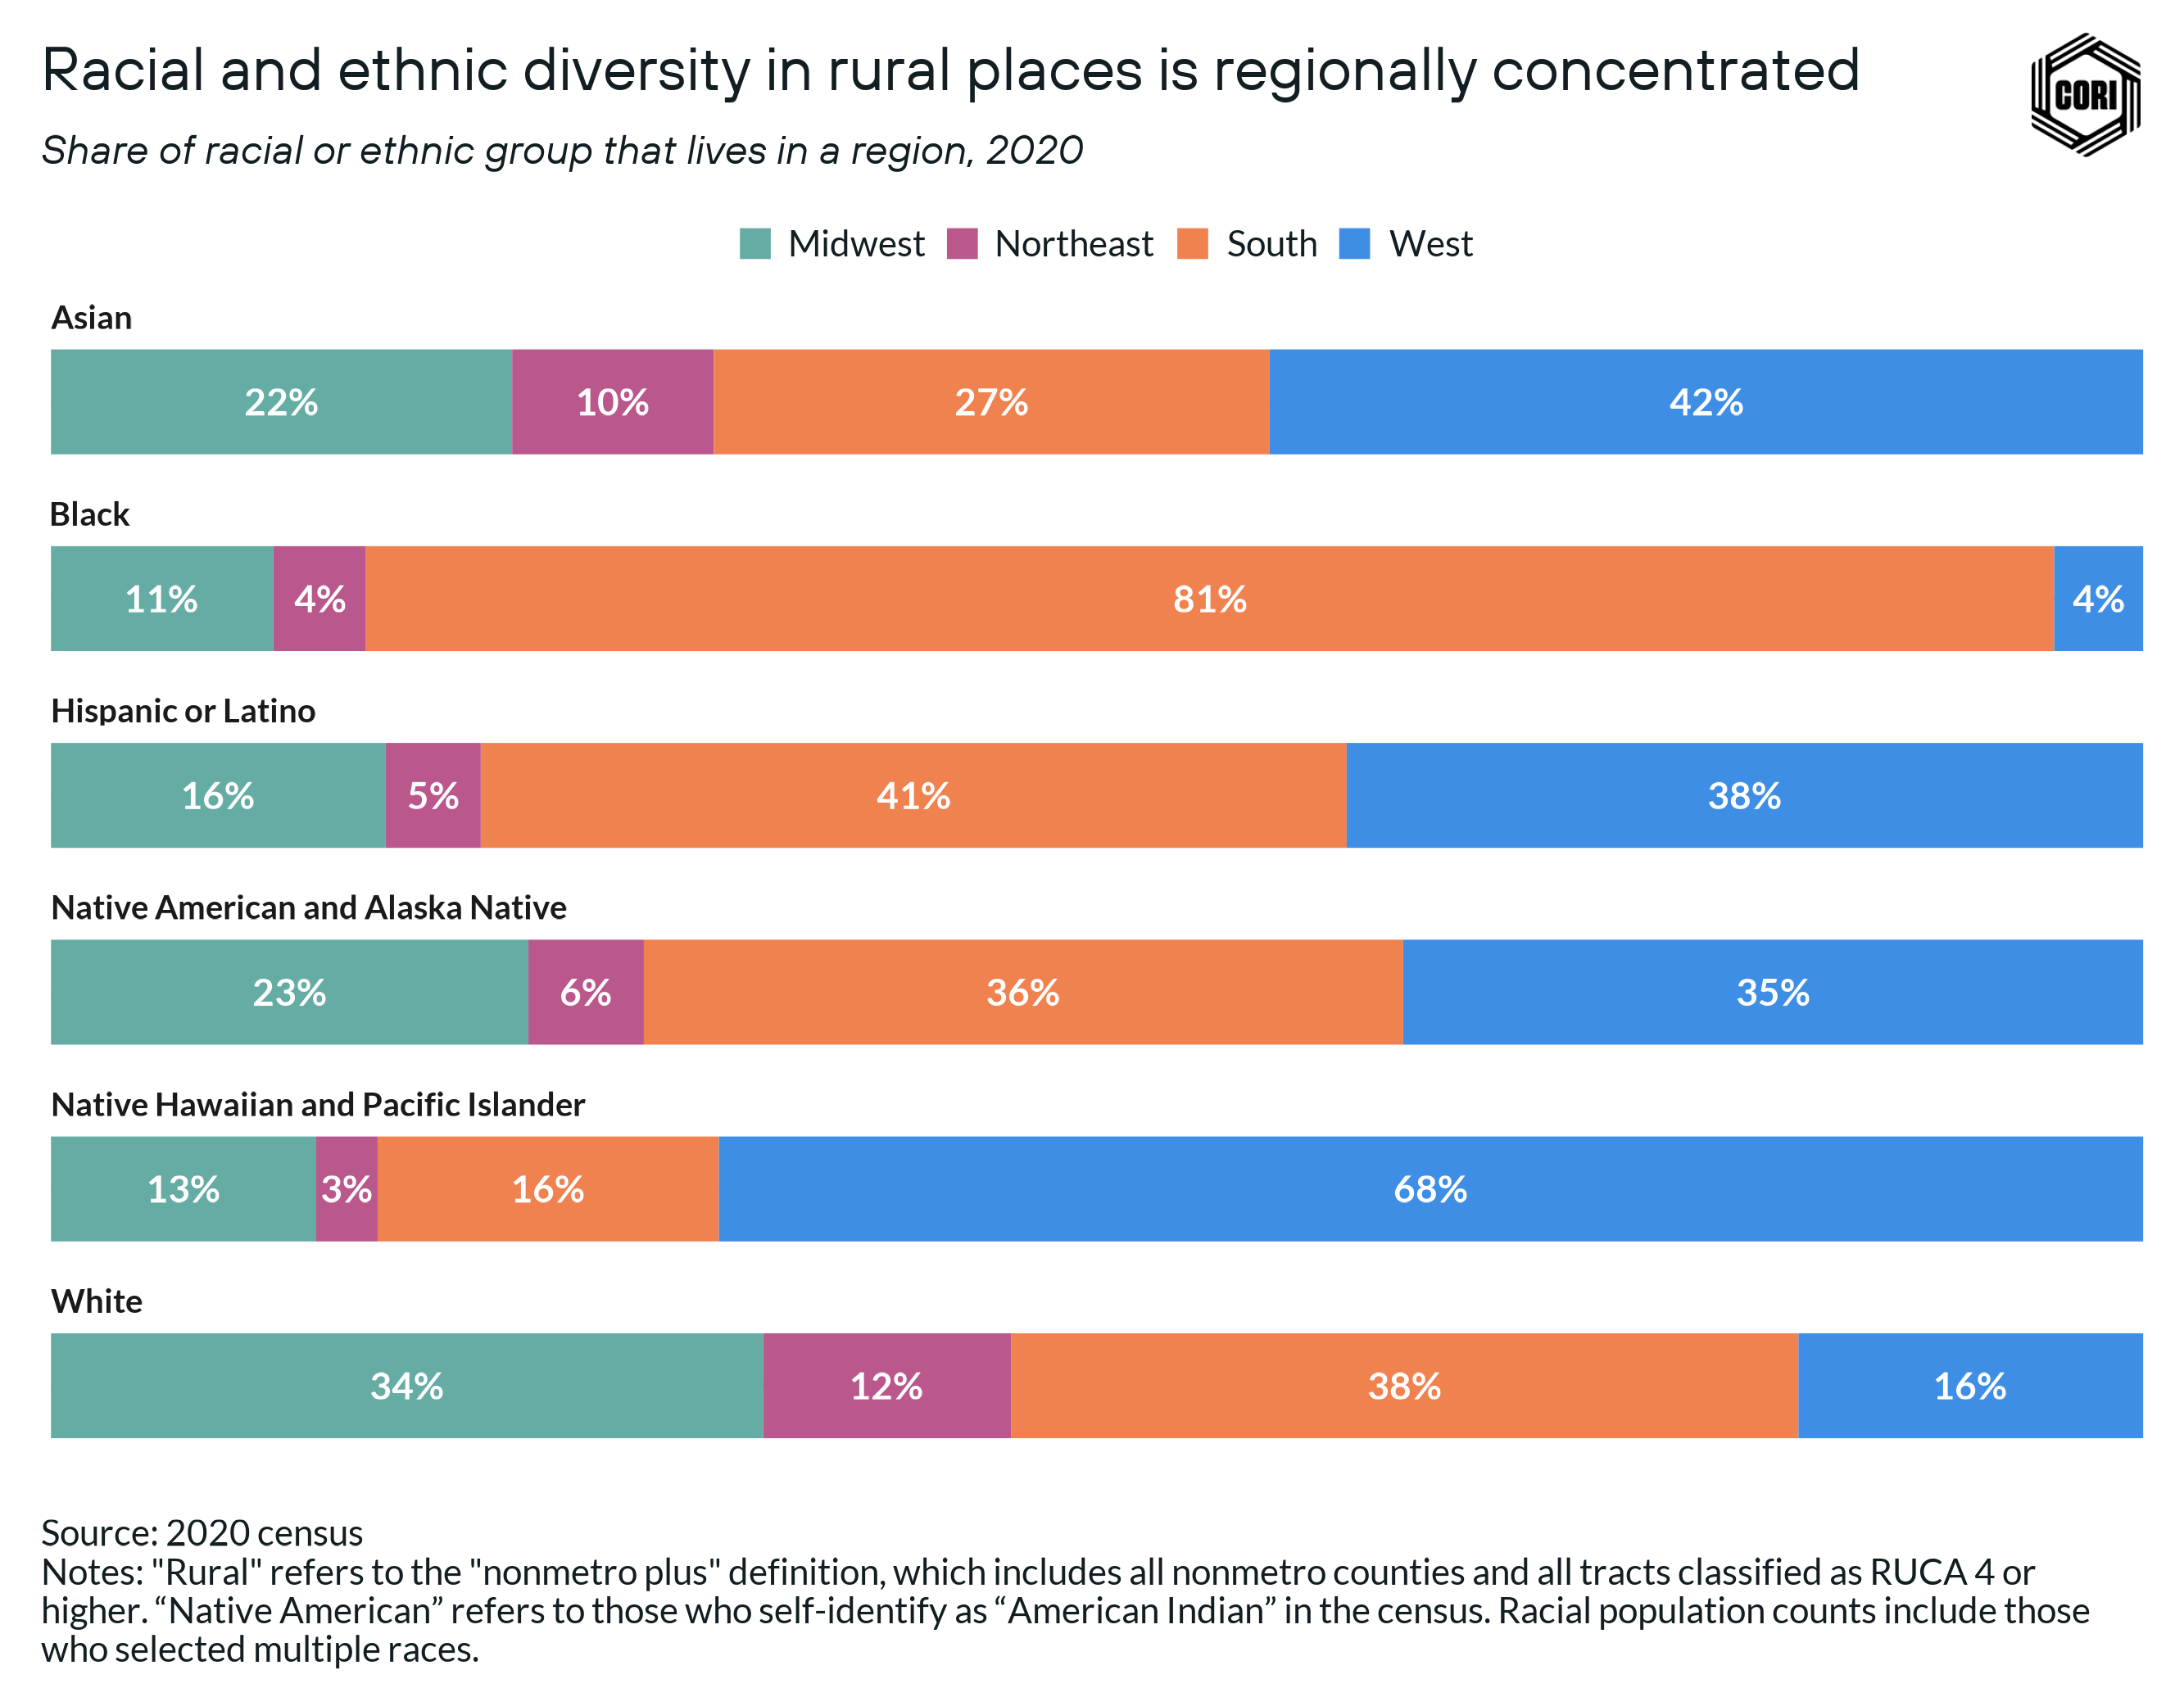
For example, the diverse rural communities we described in the previous section tend to be regionally concentrated, and thus, are easily overlooked when taking a national perspective. The rural Black population is highly concentrated in the South: Over 80% of the rural Black population lives in 15 Southern states, compared to 55% of the nonrural Black population (2020 census) (below).
Similarly, the rural Hispanic and Latino populations are more concentrated in certain parts of the country than in others. Texas is home to only 7% of the total nonmetro population, but more than 25% of nonmetro Hispanic and Latino populations (2020 census). Use the interactive map above to see where different racial and ethnic groups are concentrated around the country.
These regional patterns are rooted in historical connections, policies, and practices that have shaped rural populations, which you can learn more about in our accompanying Part 2. Over the 20th century, internal migration and immigration from abroad reshaped American cities as changing social and economic dynamics attracted people of color to urban areas. These dynamics of migration and immigration did not have the same impact on rural areas due to both cultural connections that certain groups have to specific regions of the country, as well as policies and local practices that limited people of color from moving between rural areas.
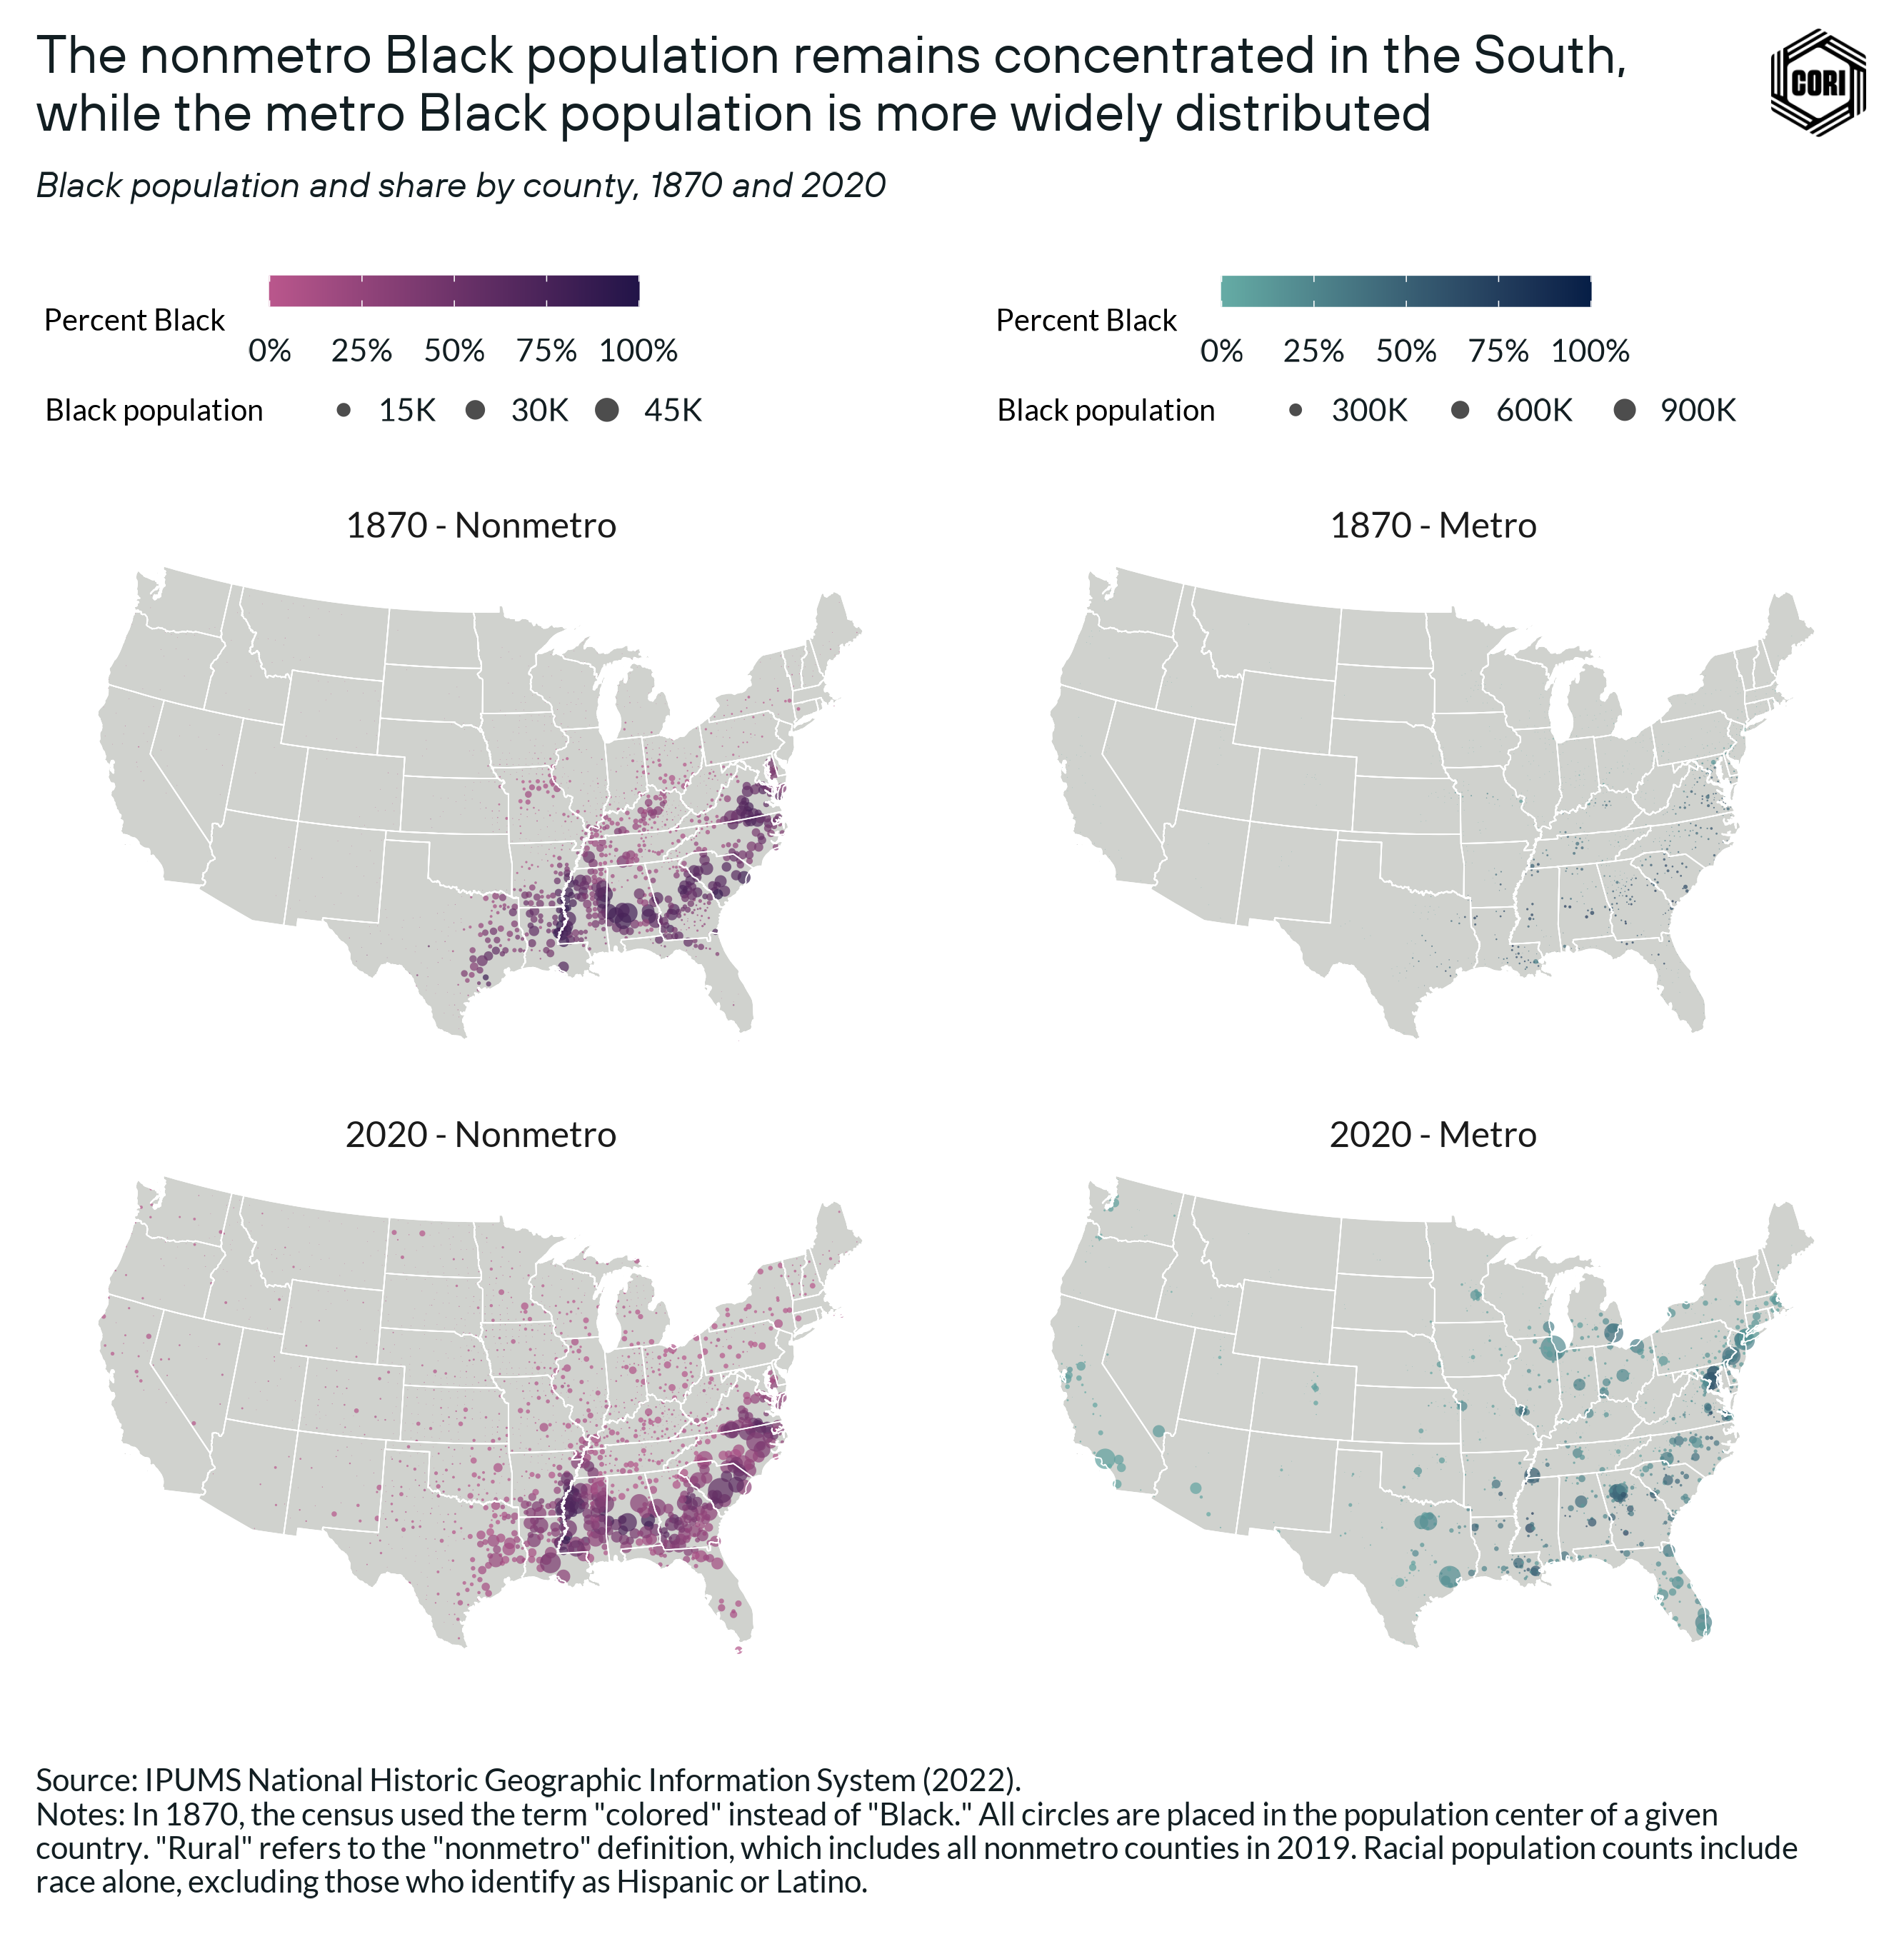
As a result, understanding rural Black, Native, Hispanic and Latino, and Asian populations requires an understanding of the historical context which has shaped where they live in rural America. For example, while the metropolitan Black population has increasingly spread throughout the country, the rural Black population remains concentrated in the South — consistent with its distribution 150 years ago (below). We explore these historical contexts in more detail in Part 2.
![]()
3. Considering rural demographics at a single point in time
When considering the diversity of rural America, often a single point in time is used. This contributes to this misunderstanding that rural America is homogeneously white because it fails to account for how changing demographics challenge this stereotype.
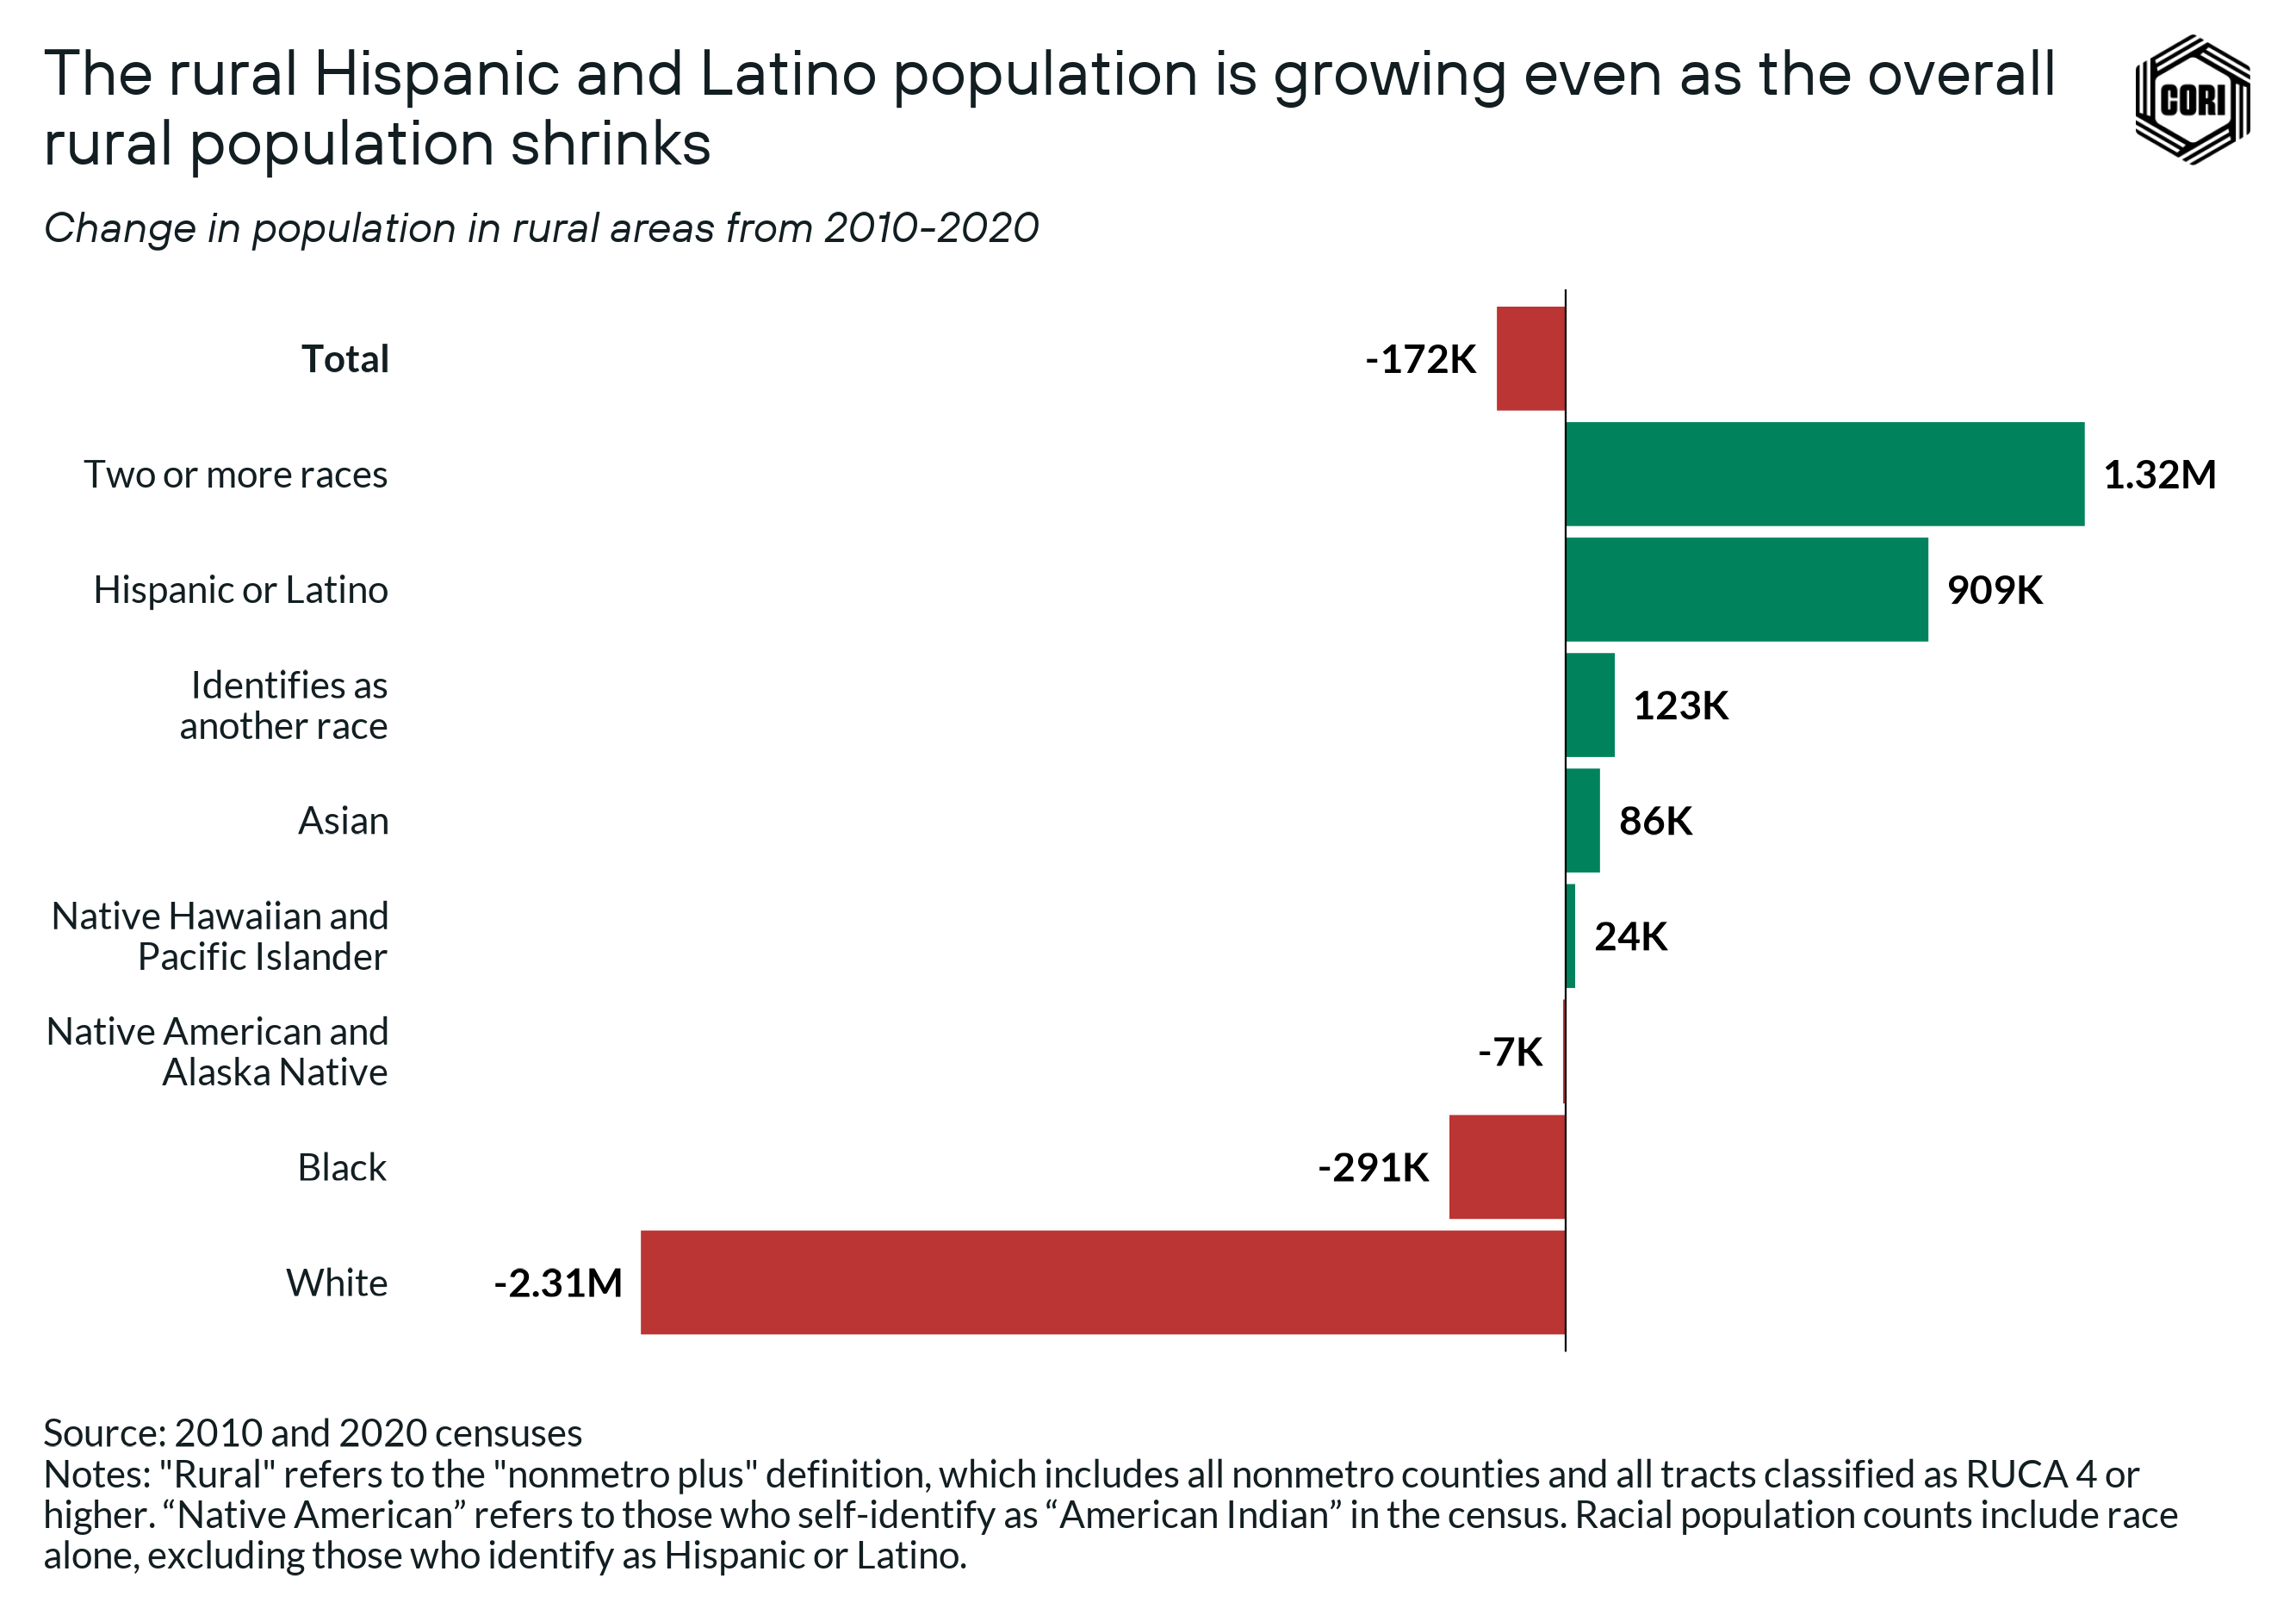
For example, in the past 10 years, measures of diversity in rural America have increased. Between 2010 and 2020, the share of the rural population identifying as a race other than white and non-Hispanic increased from 21% to 25% (2010 & 2020 census). Three dynamics have contributed to this (below) (and for deeper analysis, see the corresponding section of Part 2):
- The rural white population declined. This trend reflects broader national shifts, but the decline has been larger in rural areas. Between 2010 and 2020, the rural white population fell by 5.2%, nearly double the national rate (2010 and 2020 census). Several factors contributed to this change, including an aging white population, brain drain, and rising white mortality rates in rural America.
- Hispanic populations grew. Between 2010 and 2020, the rural Hispanic population grew by more than 900,000 people. While this growth tended to be concentrated in certain areas — with rural areas of California and Texas accounting for more than 20% of the growth — all but one state (Arizona) saw an increase in the rural Hispanic population over the past 10 years.
- More rural people identified as multiracial in the 2020 census. In the 2020 census, a new question was introduced which provided respondents greater flexibility in identifying their race. As a result, between 2010 and 2020, the number of rural Americans identifying as multiracial more than doubled, with nearly 4 million rural Americans identifying as more than one race.
Considering rural demographics at a single point in time neglects the fact that rural populations are changing and evolving, and reinforces the stereotype as unchanging and homogeneously white. Understanding diversity in rural America requires not only considering a single point in time, but looking at how diversity is changing, and what is driving those changes.
![]()
4. Using the wrong definition of rural
As we explored in the first piece of the Rural Aperture Project, the definition we use to count rural America is critical to understanding its population.
The rural definition used can have a significant impact on how we view diversity in rural America. For example, when considering the rural population with the commonly used nonmetro definition, 10.8 million people identified as Black, Native, Asian, or Hispanic or Latino in 2020. Yet, one of the shortcomings of this definition is that it undercounts people who live in places that are “rural in character” within metropolitan counties. If we correct for that by including these areas along with nonmetro counties — a definition we refer to as “nonmetro plus” — there were more than 14 million people in rural America identifying as Black, Native, Asian, or Hispanic or Latino in 2020.
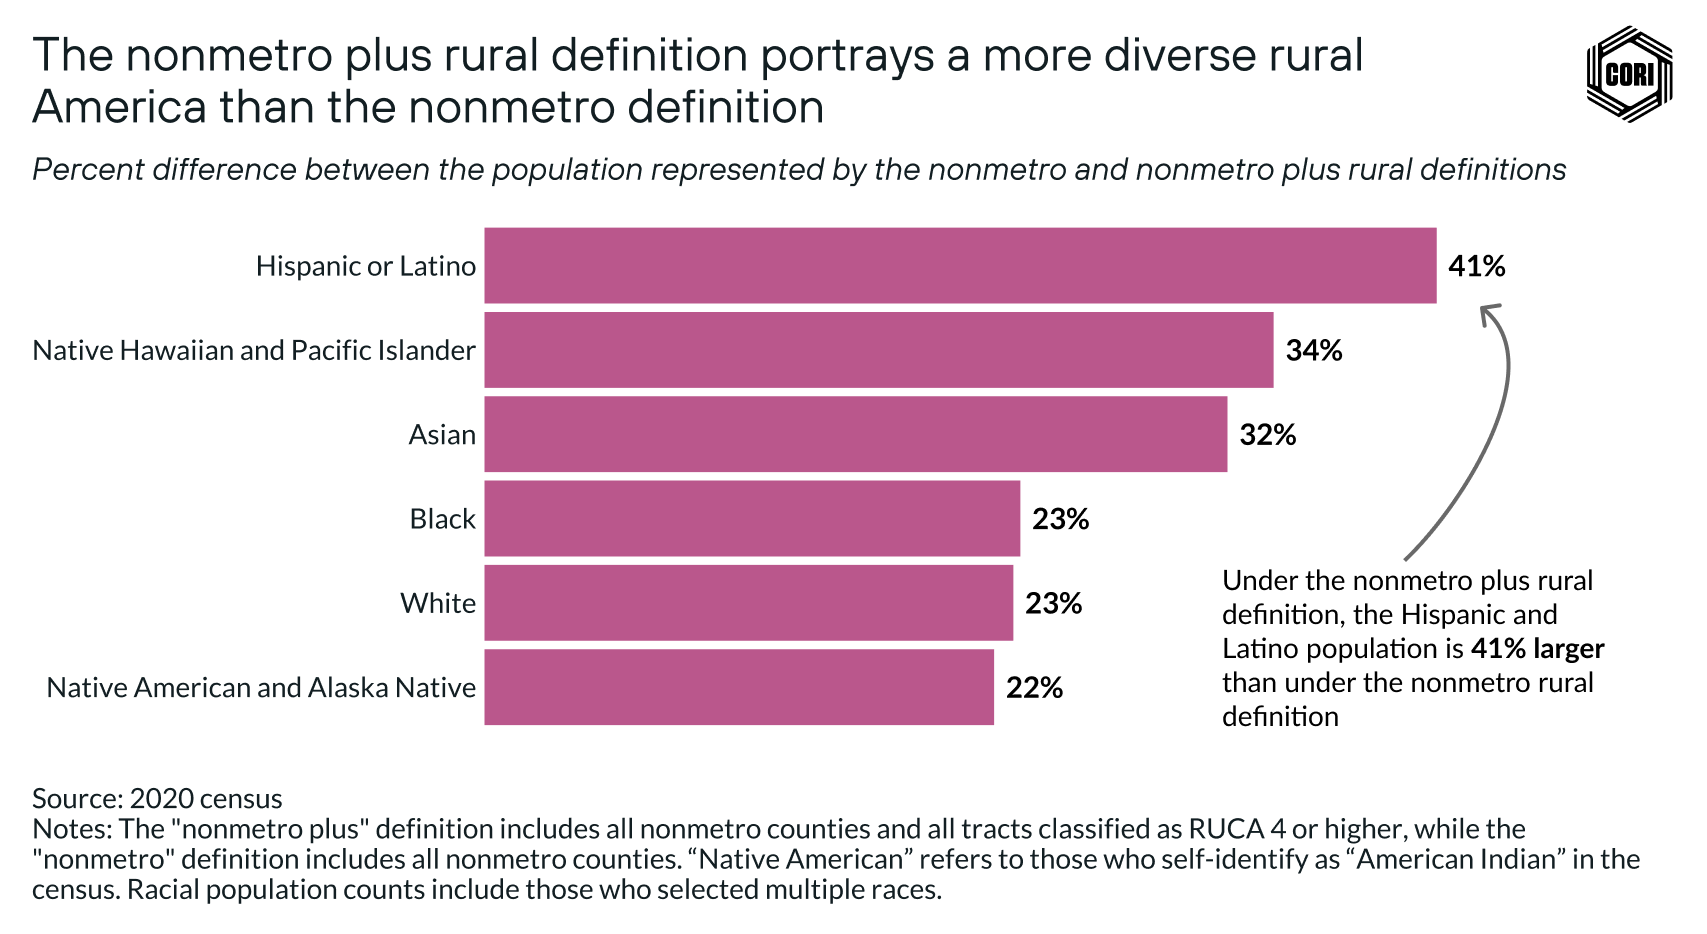
The difference in definitions impacts all groups, but most significantly Hispanic and Latino populations. Hispanic and Latino populations are 41% larger when using the nonmetro plus definition compared to the nonmetro definition. This shift has the most significant impact on California, where the rural population is three times larger when using the nonmetro plus definition instead of the nonmetro definition.
![]()
5. Taking census data at face value
The volume and accessibility of data about U.S. demographics has expanded significantly over the past 20 years. Underlying the data is a complex system of collecting and reporting. The nuances of data collection and reporting can contribute to misunderstanding if they are not considered while interpreting the data.
These issues can be particularly impactful in rural areas, where nuances can have outsized impacts in the way data is presented and interpreted. Below are two examples for how this can play out:
Example 1: Failing to account for multiracial populations makes Native populations invisible.
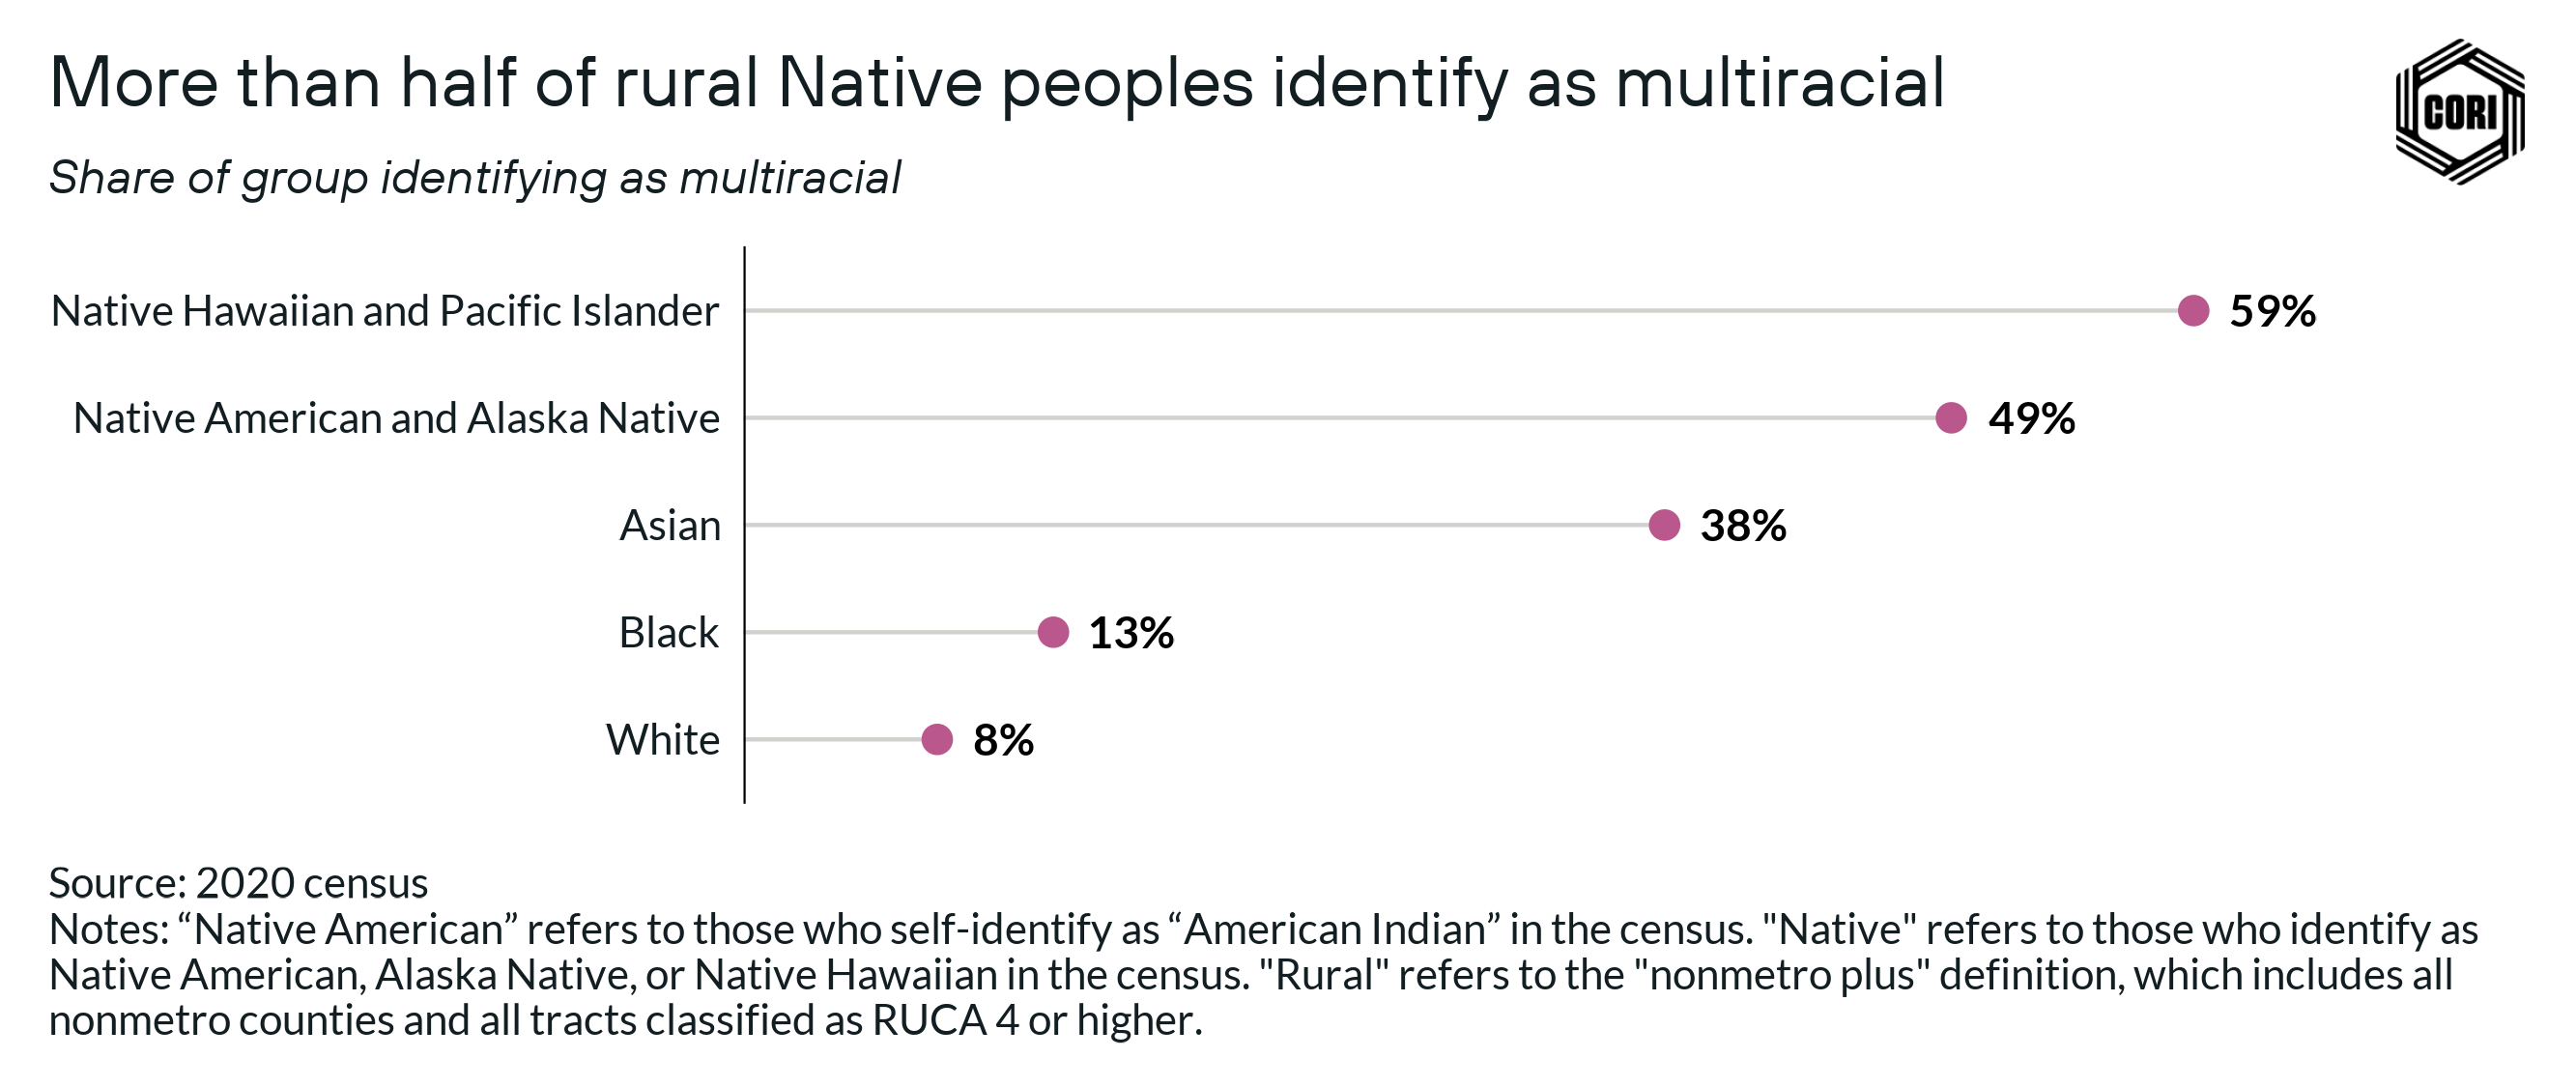
Demographic data most often reports populations that identify as a single race. For those who identify as multiracial, the census provides an alternative population count based on race that disaggregates the “two or more races” category and reports populations based on people who identify as a single race, whether with that race alone or in combination with others. This data is less commonly used because people are counted in multiple groups, yet, this data is critical to understanding rural demographics: The two or more races category represents more than 4% of the rural population.
The single-race approach disproportionately impacts Native people. In 2020, more than 55% of rural Native American and Alaska Natives, and more than 60% of the rural Native Hawaiian and Pacific Islander population reported more than one race (below). This means that over 1.2 million rural people identifying as Native American and Alaska Native are unrecognized — or “made invisible” — when using single-race data (2020 census).
Example 2: The way we analyze census data around incarcerated individuals impacts our understanding of rural Black populations.
Over the past decade, the growth in rural prisons and jails has led to a growing population of incarcerated people in rural communities. Black people are disproportionately imprisoned in the U.S., and many Black people are moved from their homes to be incarcerated in rural jails and prisons.
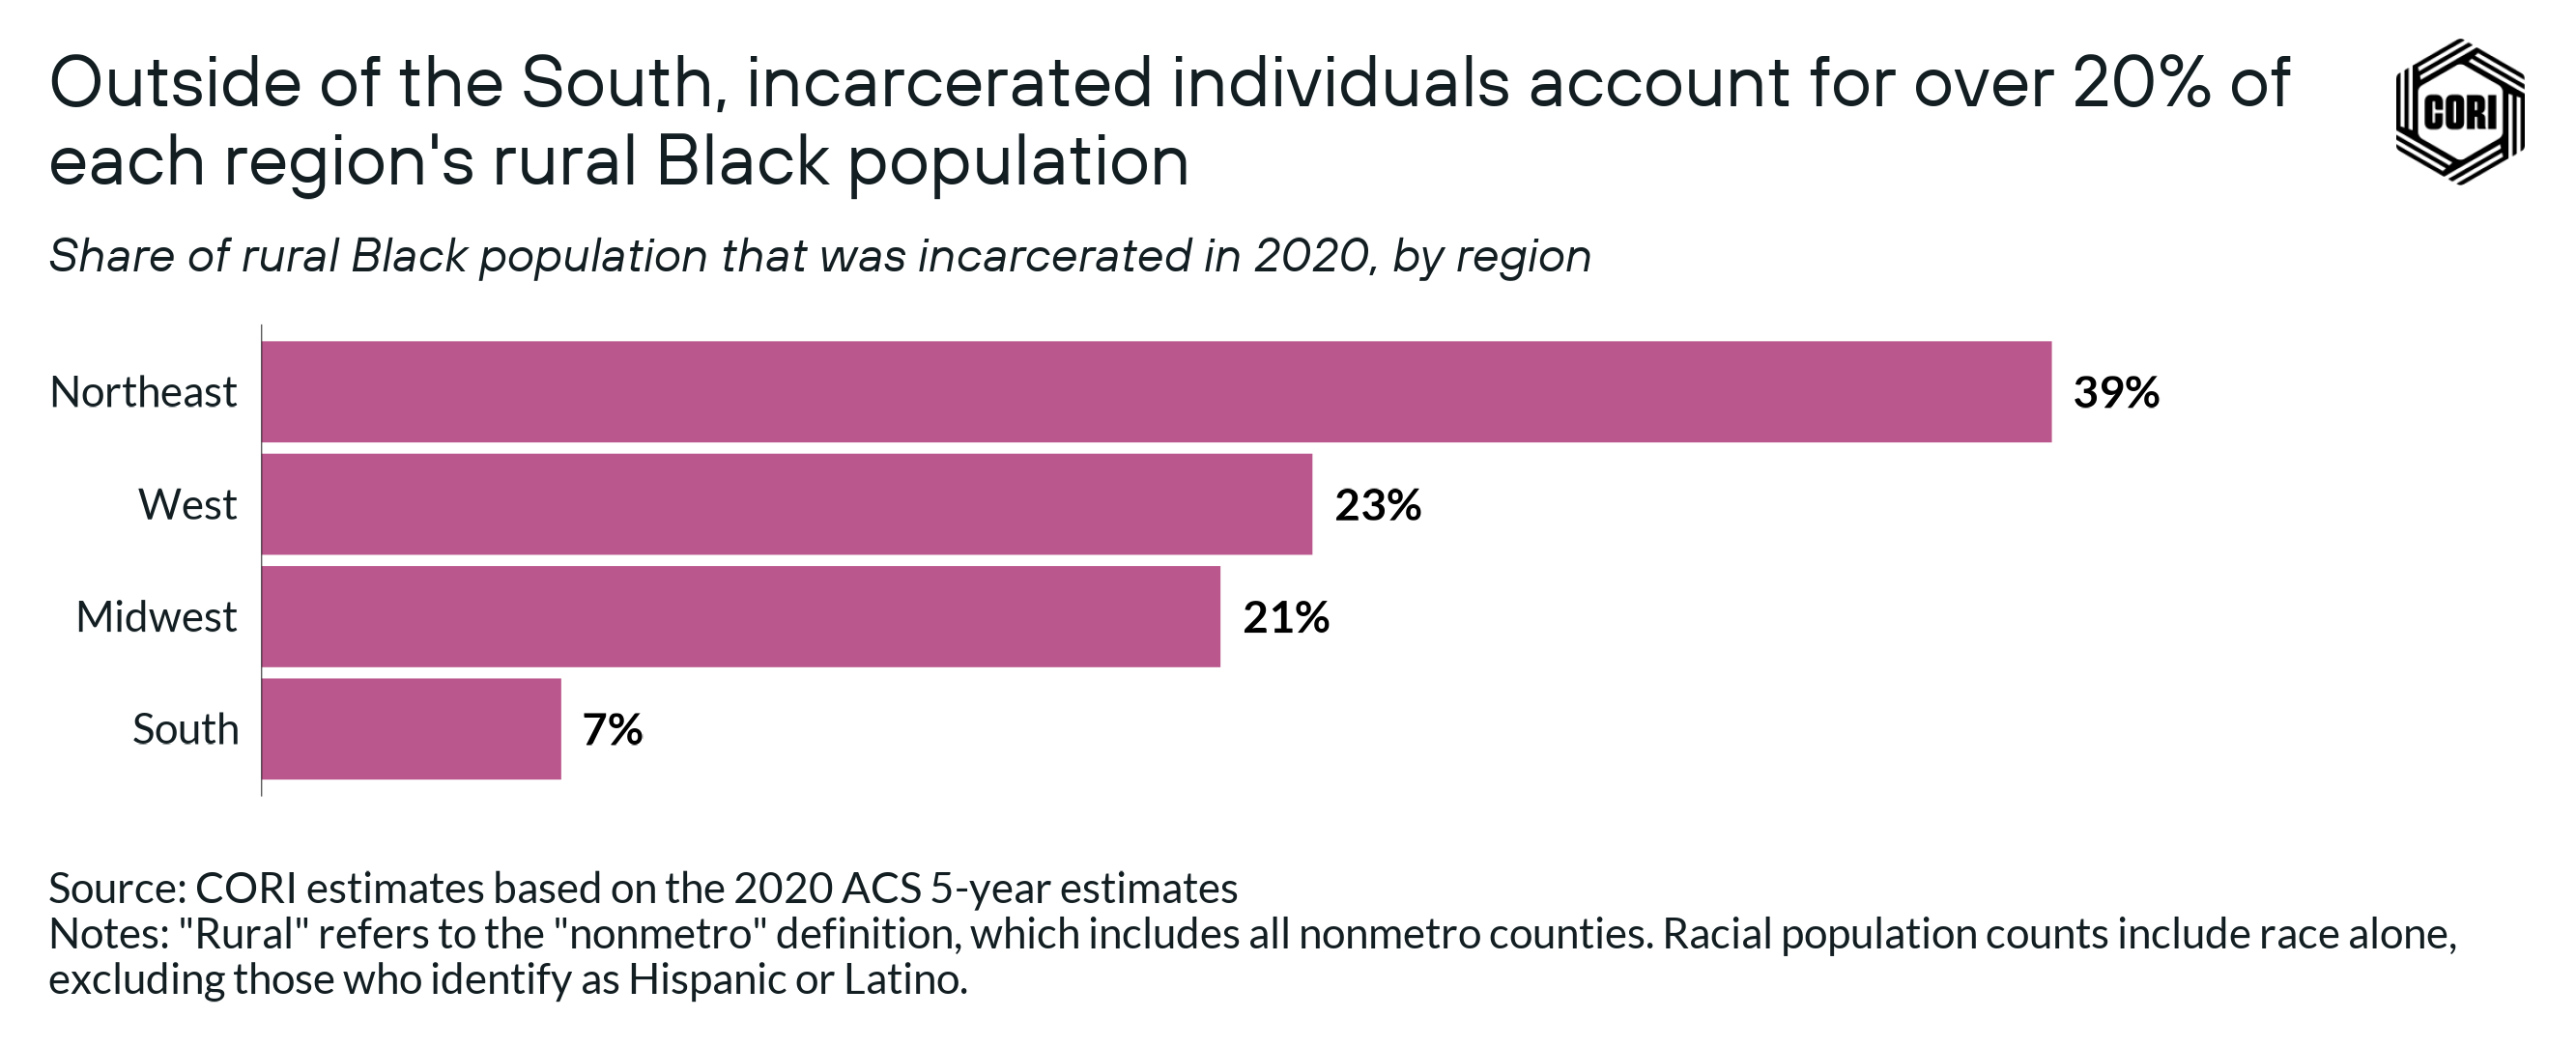
When incarcerated people are counted by the census, they are counted based on where they are incarcerated, not where they are from. When data on the total population is reported using data from the census or American Community Survey, incarcerated populations can have a large impact on populations in rural areas that have jails or prisons. Using data from the 2020 ACS, we estimate that incarcerated people represented 7% of the rural Black population (CORI calculation using 2020 ACS), including those from rural areas, as well as those moved to and incarcerated in rural areas.
At the local level, the effect on local demographic data can be significant. An extreme example of this dynamic can be found in Forest County, Pennsylvania, one of the least-populated counties in the state and the site of Forest State Penitentiary. The 2020 American Community Survey reported a Black population in the county of 1,555, representing 22% of the total population. Yet, nearly the entire Black population was incarcerated.
The impact can even be observed at a regional level. Outside of the rural South, incarcerated people made up 25% of the rural Black population, and nearly 40% of the rural Black population in the Northeast (below).
In rural areas where populations are small, nuances to the way that the census counts and reports populations can have an outsized impact on demographic data. This can contribute to misconceptions about the demographics of rural places. Those who use data to make decisions about programs, policies, and resource distribution should be aware of these nuances to ensure that resources get where they are needed most.
![]()
Recommendations for using data to advance rural racial equity
How can efforts be made to advance programs and policies that correct systemic and historic racial injustices and ensure equitable opportunity for all rural people? It begins with leveraging data to deepen understandings of race and ethnicity in rural America. When the misconception that “rural America is homogeneously white” renders people of color invisible by data, practice, or policy, it simultaneously privileges the voices, experiences, and concerns of only a subset of the population, and neglects to afford rural people of color the resources and attention necessary to meet the needs of everyone in a given community.
As governments, philanthropies, and corporations make historic advancements in addressing issues around racial equity, there are several practices that we recommend for using data to advance these efforts:
1. Focus on rural populations as a unique entity, not on comparisons with urban areas and the country as a whole
The context and dynamics that shape race and ethnicity in rural America are different than in urban America. Using national and urban benchmarks to compare rural demographics has the effect of making rural Black, Hispanic and Latino, Asian, and Native populations invisible, and contributes to the stereotype that rural America is homogeneously white.
Using national or urban benchmarks for targeting racial equity efforts or setting eligibility for funding can have the unintended consequence of deepening inequities. As more government agencies and philanthropies seek to advance racial equity, there is increasing use of diversity-based benchmarks for targeting programs and fundings. Systems that use broad measures of diversity and national benchmarks to target programs or investments to advance racial equity can have an unintended effect of excluding large portions of the Black, Hispanic or Latino, Native, and Asian populations living in rural America.
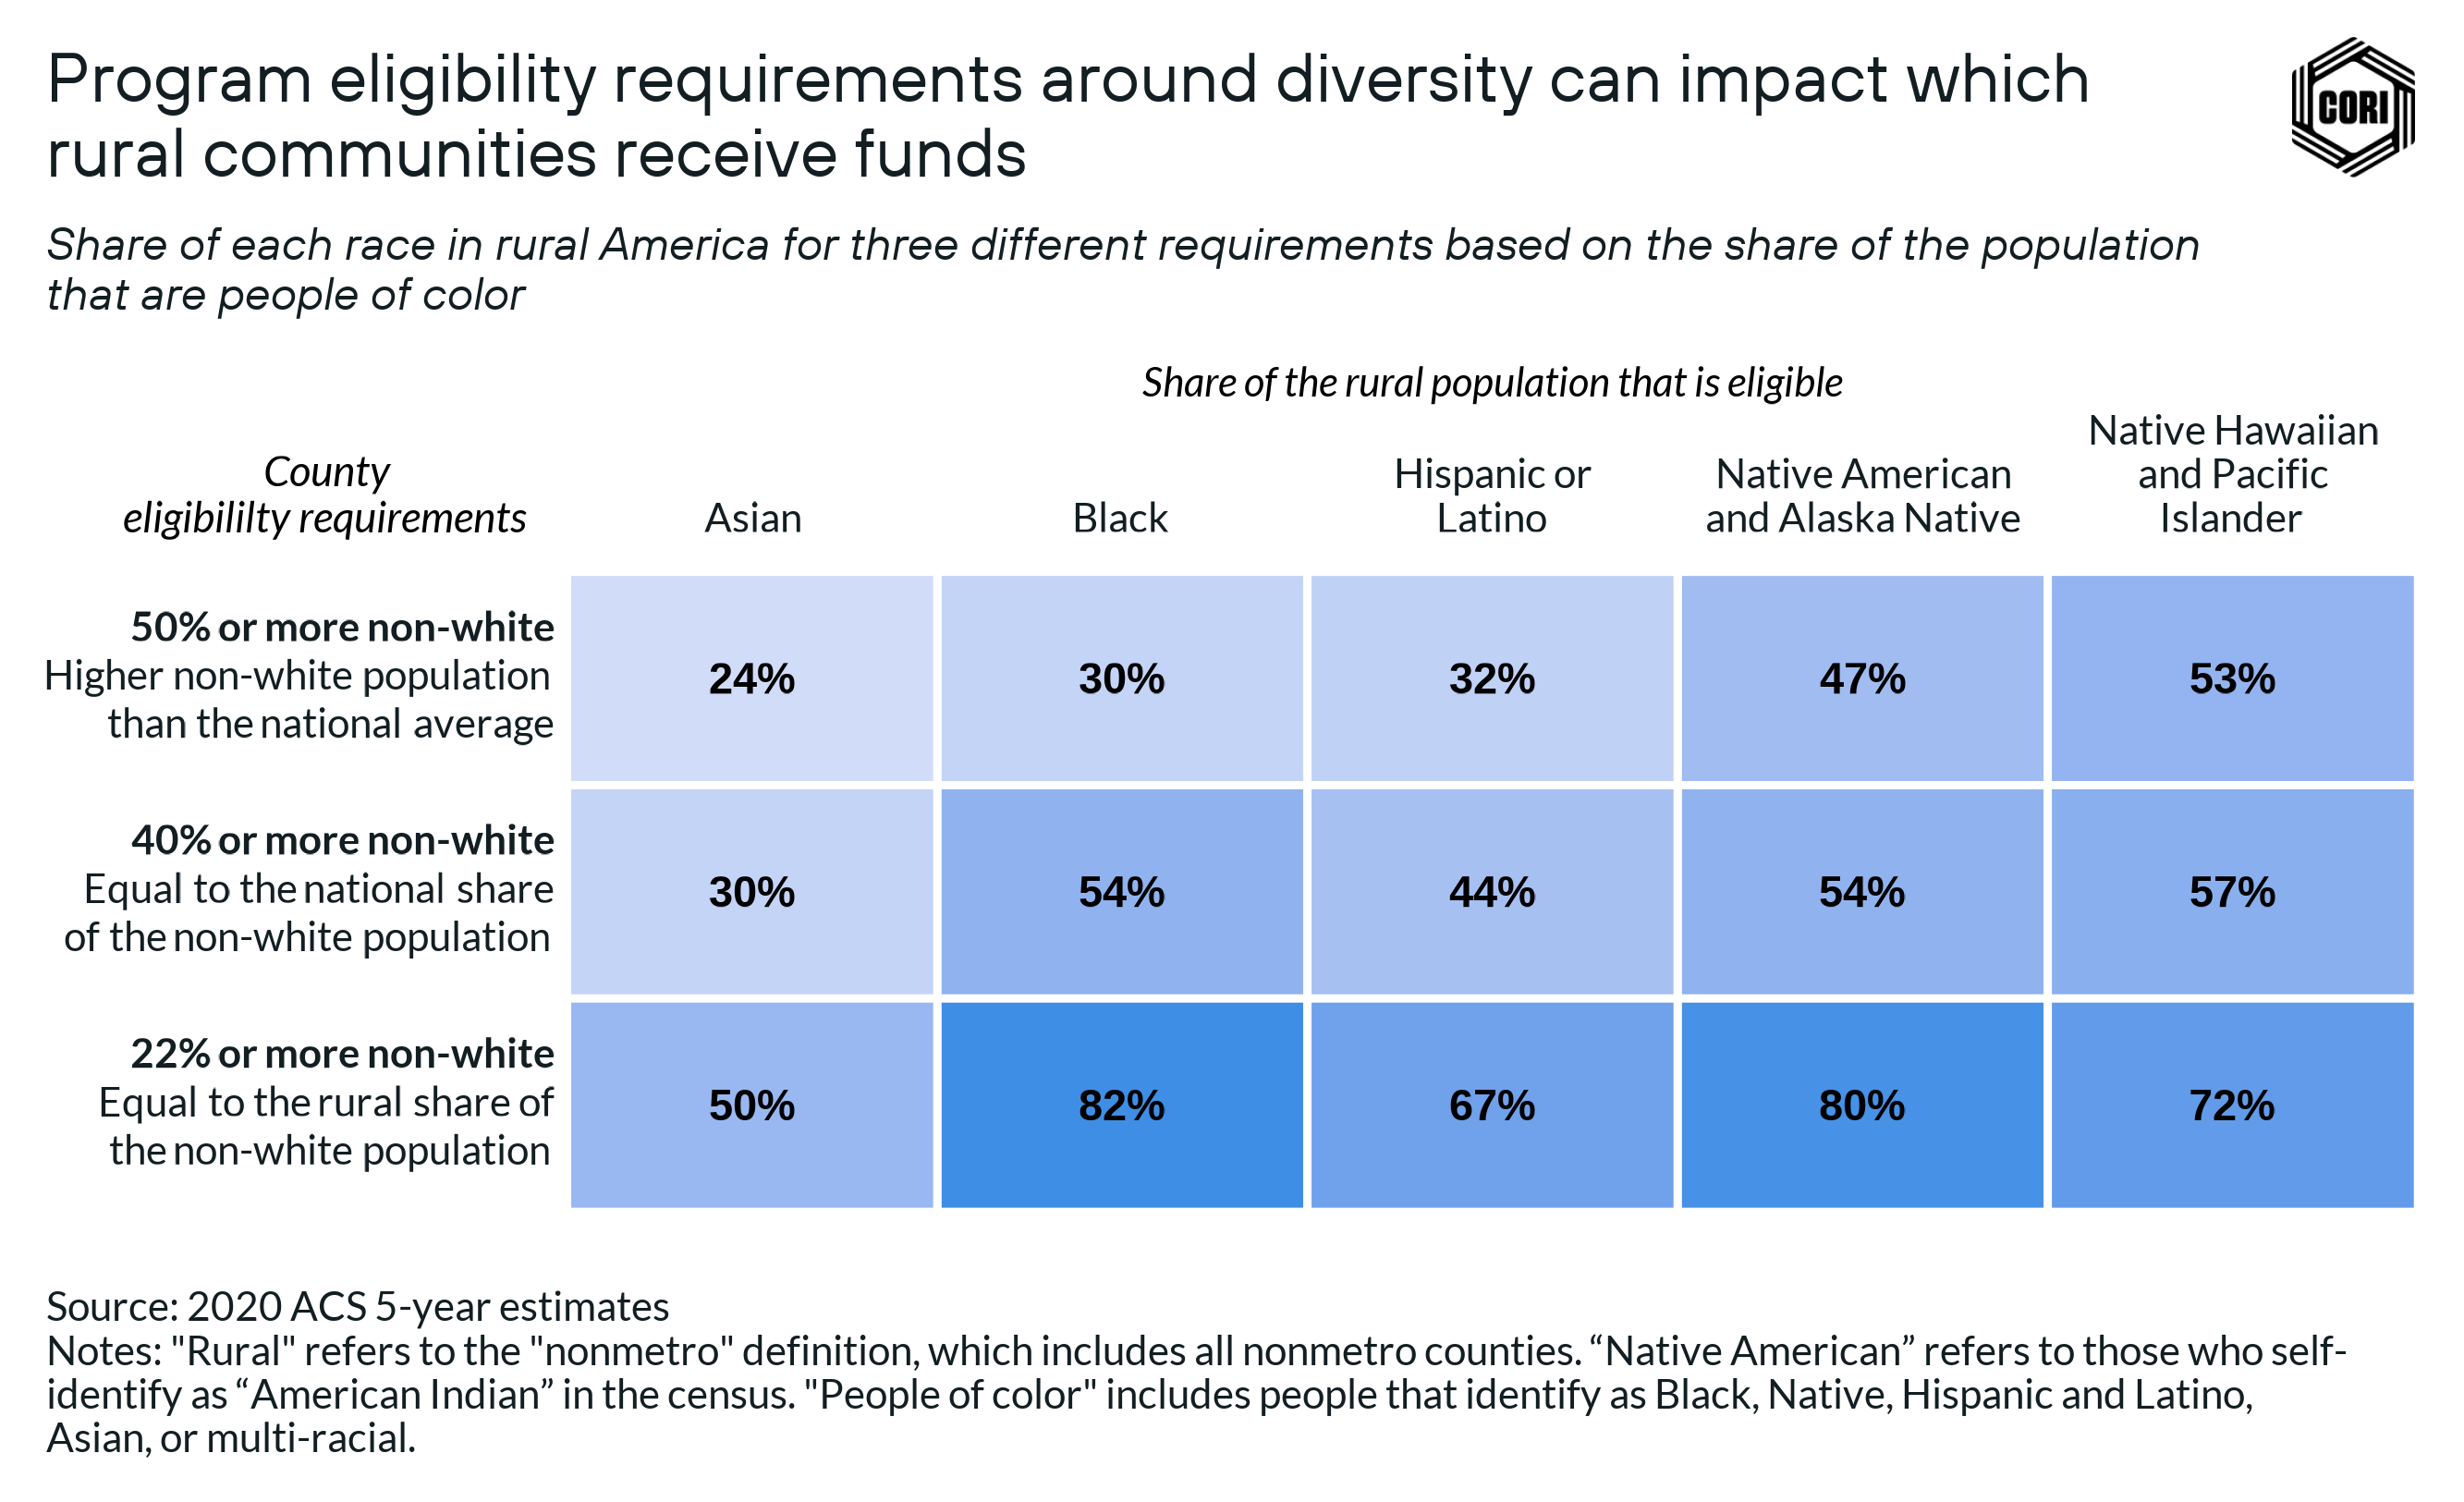
Consider an organization that wants to provide workforce development grants to communities to help people of color pursue high-paying jobs. To target the program to more diverse areas, the organization decides to set the program eligibility for counties that are “more diverse than the country as a whole” using the share of the non-white population as the threshold.
If the organization set the threshold for counties that have populations that are made up of 50% or more people of color, there would be 223 qualifying rural counties. While these areas would be more diverse, they would represent less than one-third of the rural Black and Hispanic or Latino populations, and around half of the rural Native populations (below).
Even when decreasing the threshold to 40% to align with the national share of the population of color, just around half of the rural Black, Native, and Hispanic or Latino populations would be included. Lowering the threshold even further to 22% to align with the rural average leaves out almost half of the rural Asian population, and more than 25% of the rural Hispanic or Latino population because these populations tend to live in rural counties with a higher share of white populations.
Data should be used to bring visibility — not invisibility — to rural Black, Native, Hispanic and Latino, and Asian populations. Eligibility requirements and systems for allocating resources should be based on the specific context of rural America. Instead of using national and urban benchmarks as the starting point for defining diversity, benchmarks should be used to deepen understanding of how the experiences of BIPOC people living in rural America are similar and different to the rest of the country so that appropriate programs and policies can be designed to serve them.
2. Adopt a regional approach when using rural demographic data
Rural America is often treated as a single region in research and analysis, but in reality it is made up of many regions that differ in terms of demographics, economics, resources, and environment.
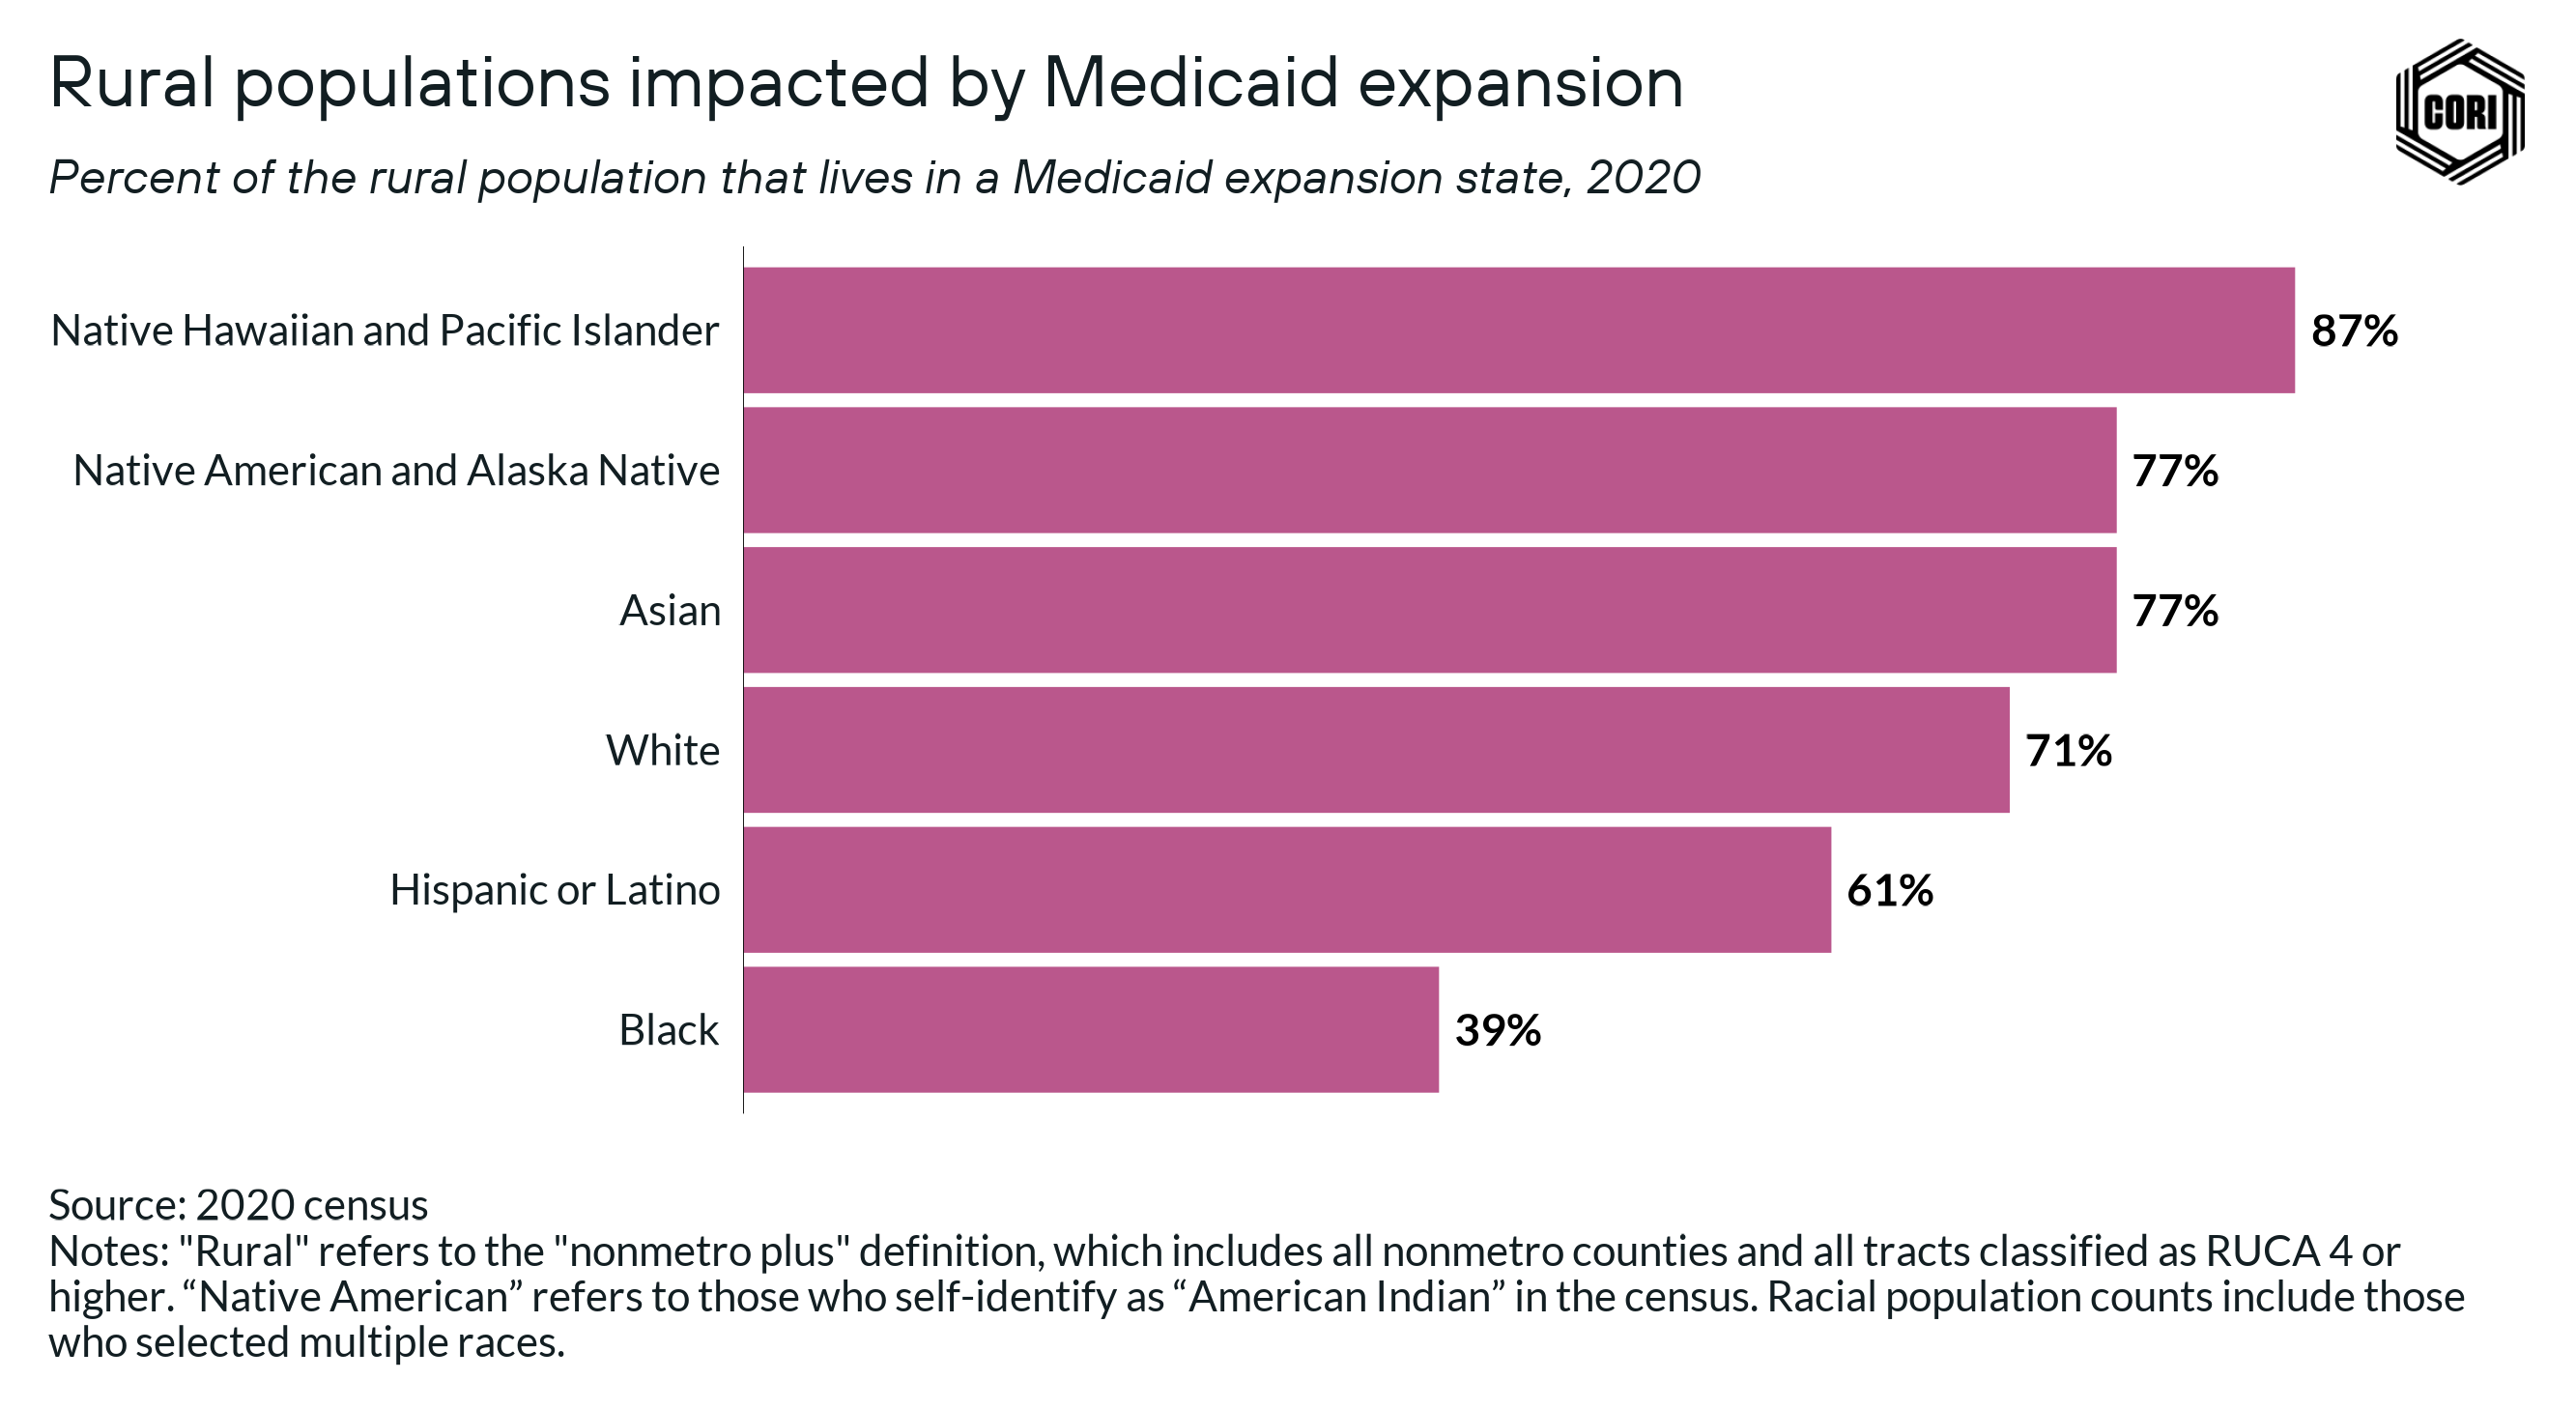
The distinctive geographic patterns across demographic groups in rural America means that different racial and ethnic groups are impacted differently both by the unique economic and policy dynamics surrounding them. For example, Medicaid expansion has been a policy with regional variation in the states that have and have not adopted and implemented the expansion. Many of the states that have not expanded Medicaid are in the South, disproportionately impacting low-income rural Black people compared to other groups. In 2020, just 39% of the rural Black population lived in a state with Medicaid expansion (below).
Conversely, more than 75% of the Asian, Native American and Alaska Native, and Native Hawaiian and Pacific Islander populations live in states that expanded Medicaid. These regional differences can have important implications for designing programs and policies that address racial equity, such as voter identification and federal minimum wage laws.
3. Pay attention to demographic changes over time
One of the consequences of the stereotype that rural America is homogeneously white is that it implies that it does not change. In reality, rural America is a very dynamic place, with a constant flow of people moving in and out. These dynamics impact data on rural demographics both at a national level and a local level, and considering changes over time should be central to using data to understand rural demographics, and to designing programs and policies.
As we will explore more deeply in Part 2, Hispanic and Latino populations have grown in rural areas over the past decade. Across the country, the Hispanic and Latino people moving into these areas have served as a lifeline for rural communities experiencing population declines among other groups. Considering demographics over time can also bring attention to and raise questions about the diversity of experiences within racial or ethnic groups. For example, the experiences, opportunities, and challenges faced by Hispanic and Latino people moving into rural areas are very different from the experiences, opportunities, and challenges of Hispanic and Latino people living in rural communities where Hispanic and Latino people have been rooted for generations.
Considering changes over time challenges us to update our assumptions about the way demographic data is interpreted. As the 2020 census showed, millions of people in rural America identify themselves as multiracial, but were not previously counted by the census. This update challenges past interpretations and stereotypes about rural demographics, and helps us deepen our understanding of racial identity among the rural populations.
4. Account for who is and is not included in different rural definitions
The population that is counted as rural is based on the definition that we use for rural America. Different definitions can tell different stories about rural America. It is critical to understand who is and is not being counted using different rural definitions.
While the nonmetro definition is a commonly used definition of rural America, we show that the populations counted as rural across groups grow by at least 20% when using the nonmetro plus definition, which aims to include rural communities located in metropolitan counties along with nonmetropolitan counties. The impact is most significant among rural Hispanic and Latino populations, which is more than 40% larger when using the nonmetro plus definition compared to the nonmetro definition.
As we discussed in “Defining rural America: The consequences of how we count,” the populations that are caught in the middle of rural definitions are most likely to miss out on access to resources from government and philanthropies. Whether one is using data for research or for designing programs and policies, it is critical to be intentional about the choice of rural definition, and account for who is and is not included based on the definition in use.
5. Go beyond the top-line numbers
Too often, only the top-line numbers are considered when using data to understand rural demographics. This practice contributes to misunderstandings about rural populations, and can lead to poor policy and program design because critical differences between and within the top-line race and ethnic groups are not accounted for. There are several ways that the census can help data users go beyond the top-line numbers:
- Account for people who select more than one race. As we discussed, using census data that reports populations based on people who identify as a race alone or in combination with others is critical to understanding race and ethnicity in rural America. This data is particularly important for getting accurate counts of the rural Native and Asian populations.
- Disaggregate demographic data on race and ethnicity to bring attention to critical differences between and within groups. For example, the Asian group defined by the census includes a vast array of countries, cultures, and languages. The Asian population within rural America represents this diversity, and disaggregating the data brings critical insights about the different backgrounds and experiences of rural Asian people that are critical to designing effective policies and programs.
- Understand how racial and ethnic groups are constructed in the census. Nuances in the way the census asks questions and reports populations can lead to misinterpretations of demographic data. For example, changes in the way the census asked people about their race led to a significant increase in people identifying as multiracial in the 2020 census. Additionally, the fact that total population counts include incarcerated individuals can have a significant impact on the demographics of rural communities. Understanding these nuances, and incorporating this understanding into interpretation of rural demographic data is critical.
6. Recognize that power and privilege often trump population numbers in rural areas
Despite often comprising a large portion of the population in rural areas, Black, Hispanic, and Native American communities can still lack power and influence over how local decisions are made or resources are used. This is due to a history of local elites prioritizing their own interests and disregarding the needs and concerns of these communities.
To address this imbalance and ensure that policies and programs benefit all members of these communities, it is important to consider the ways in which power and privilege have historically been used to perpetuate inequality, and to work toward increasing the representation and influence of Black, Hispanic, Native American, and Asian populations in decision-making processes related to resource allocation in their communities.
![]()
Conclusion
Rural America is home to a diverse range of racial and ethnic groups. By understanding the complex relationships between race, ethnicity, geography, history, and demographics, we can make better decisions to improve the lives of all rural Americans.
Demographic data and data visualizations are a critical tool to advancing racial equity. In this piece, we’ve used data to give representation to people that are often overlooked or left out of the rural narrative. We’ve provided context to the historic and current day forces that shape the rural places and communities where different groups live, and explored the intersection of race, ethnicity, and place in rural America. We hope that the insights gained from a close consideration of the demographics of rural America can help design more effective programs and policies to advance racial equity.
We encourage you to delve into Part 2, “The geography of race and ethnicity in rural America,” to explore how we put our “good data practices for advancing racial equity” into use.
![]()
About our partners
MDC: MDC is a nonprofit organization that partners with Southern leaders and communities to catalyze systemic change and allows more people to thrive, and offers research and analysis, community change and advisory services that can help communities create an “infrastructure of opportunity” — the aligned systems and supports that can boost everyone, particularly those who’ve been left behind, to higher rungs on the economic ladder.
Thrive Rural: A small group of Robert Wood Johnson Foundation grantees is working collaboratively towards a future where communities and Native nations across the rural United States are places where each and every person belongs, lives with dignity, and thrives. This work is one piece of that effort. For more information, please visit ThriveRural.org.
Robert Wood Johnson Foundation: The Robert Wood Johnson Foundation is committed to improving health and health equity in the U.S. In partnership with others, it is working to develop a Culture of Health rooted in equity that provides every individual with a fair and just opportunity to thrive, no matter who they are, where they live, or how much money they have.
![]()