Three reasons COVID-19 is creating a rural employment crisis

Rural America during COVID
The COVID-19 pandemic is creating a health crisis unlike anything we’ve ever seen. But the disease’s damage doesn’t stop there. With millions of people forced to stay at home, the economy has cratered. 701,000 people lost their job in March alone — the worst month for American jobs since the Great Recession in March 2009.
At CORI, we knew there was an economic crisis happening in rural America even before this crash. Small town industries have been declining, tech jobs have boomed only in cities, and young people have left their rural hometowns in search of opportunity. And without good access to broadband, rural areas haven’t been able to tap into the digital economy’s growth.
All those existing challenges made us worried about what could happen when a COVID-related recession hit.
Led by our in-house economist Mark Rembert, we created an Employment Risk Index, which ranks counties by how vulnerable they are to losing jobs based on three factors relevant to the COVID crisis: employment in high-risk industries, employment in small businesses, and age of workforce. What we found was troubling: Rural America faces a disproportionately high employment risk.
20th-century industries are hardest hit
Our analysis found four industries at highest risk from COVID-19, whether through decreased demand or an inability to employ remote work: tourism, manufacturing, transportation, and natural resource production. In metro areas, these industries make up just 43% of all jobs. In rural areas, they represent an astonishing 56%.
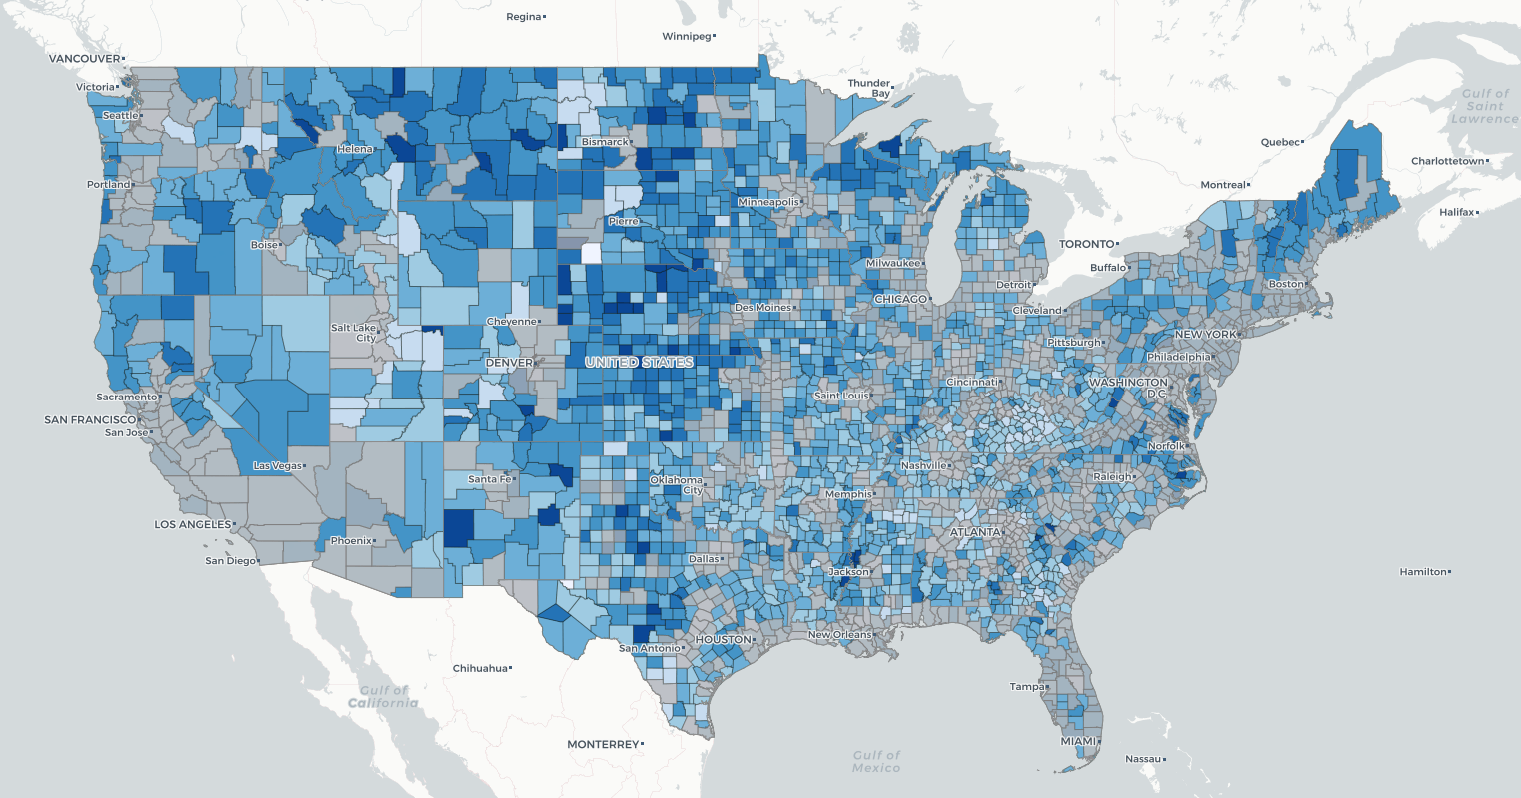
Small businesses are not recession-proof
Small businesses — defined as those with under 50 employees — are hit hardest by recessions, as we saw in 2008. They have a harder time accessing credit, and don’t have the excess cash to weather a long storm. They’re also more important to rural economies: We calculated that 35% of rural employment comes from small firms, compared to just 27% of urban employment. 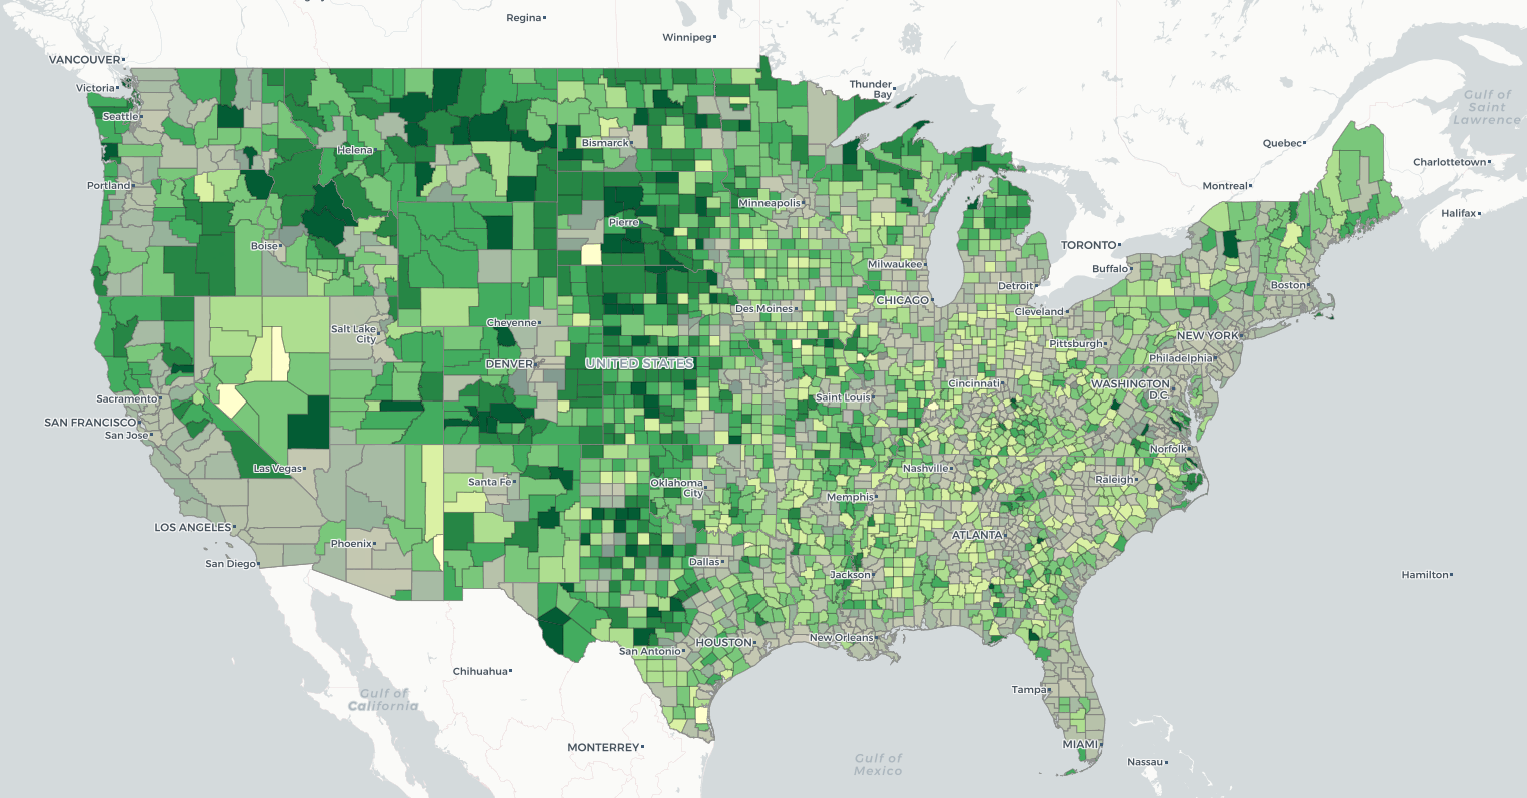
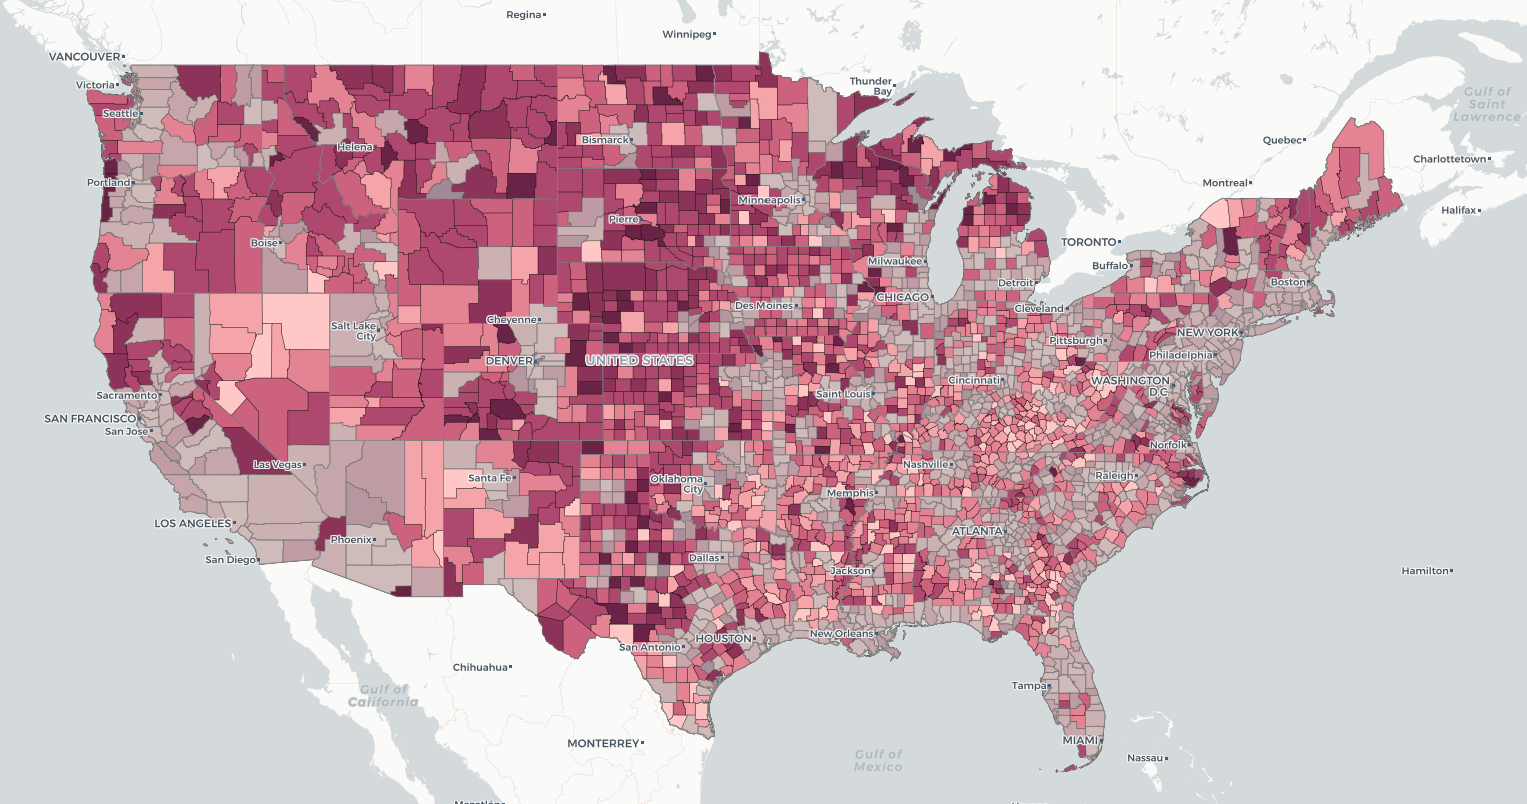
Older Americans face risks beyond health
People over the age of 55 face the highest mortality risk from COVID-19. That threat trickles into the economy, as older workers who are hospitalized drop out of the workforce, and companies that employ older workers have to embrace stricter social distancing.
Again, rural areas face higher risk: our analysis found that 24% of rural workers are older than 55, compared to 22% of urban workers. While the overall difference isn’t severe, there are pockets of rural places with incredibly high concentrations of older workers.
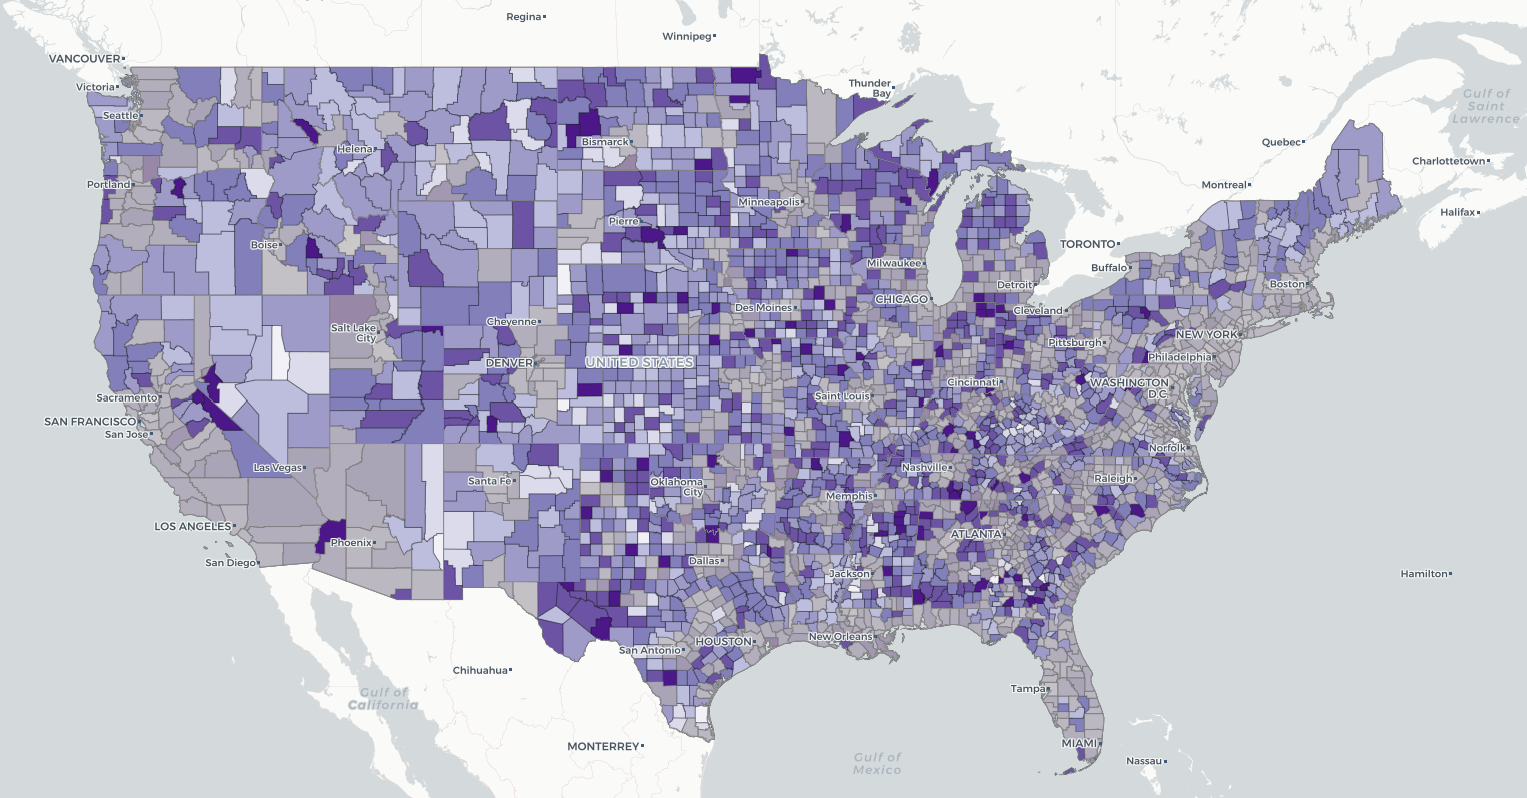
The full extent of the crisis
Combining these three factors together, our Employment Risk Index shows which places face the greatest threat overall. Too many of the most at-risk communities are rural. And unfortunately, these findings probably still underestimate the extent of the coming crisis.
Many rural communities face a deep disadvantage, but because of already high unemployment and poverty, won’t lose as many jobs. Still, these communities are facing challenges just as big, and we need to make sure they’re included in recovery efforts.
Economies of the future
Rural economies need to diversify, embracing the jobs of the future in tech and innovation.
With remote work on the rise, we need to continue efforts to deliver universal broadband. And as we’ve learned from our work with rural communities nationwide, we need to create digital skilling programs that train rural residents for future jobs, while supporting the growth of digital economy ecosystems that provide support and resources to the next generation of rural tech entrepreneurs.
A rural crisis is on its way. But if we can understand where the threat is coming from, and how tech can be part of the solution, we can transform rural communities to thrive in our increasingly digital world.
Stay connected
To learn more about our mapping and data analytics work, or to request a map you’d like to see, please don’t hesitate to send us an email. To learn more about the methodology we used to design this analysis and build this map, please click here.