Measuring the Pulse of Entrepreneurship
By: Amanda Weinstein Ph.D, Adam Dewbury Ph.D, and Olivia Gonzalez Ph.D

Inside the Rural Entrepreneurship Index
Introduction: Why Rural Entrepreneurship Needs Better Measurement
Entrepreneurship has long been one of rural America’s greatest strengths.1 And it remains one of rural communities’ best tools for furthering economic development, providing pathways for wealth-building, job creation, and building community resilience.2 When rural Americans start businesses, they not only create jobs, they build wealth that stays rooted locally.3 But until now, rural communities haven’t had a clear, data-driven way to understand just how entrepreneurial they are or how they compare to peers. The Rural Entrepreneurship Index, developed in partnership with the Capital One Insights Center, changes that, helping communities see where they are on the journey toward a more vibrant entrepreneurial ecosystem.
Defining Rural Entrepreneurial Ecosystems
Entrepreneurship isn’t one number; it’s a pattern. And that pattern emerges when you look across multiple indicators.4 The Center on Rural Innovation’s Economic Development Tool provides data on many of these entrepreneurship measures for rural counties, defined as nonmetropolitan counties under the Office of Management and Budget classification.5 Among the most common indicators of local business dynamism are business entry and exit rates, which capture the churn of businesses in a community.6
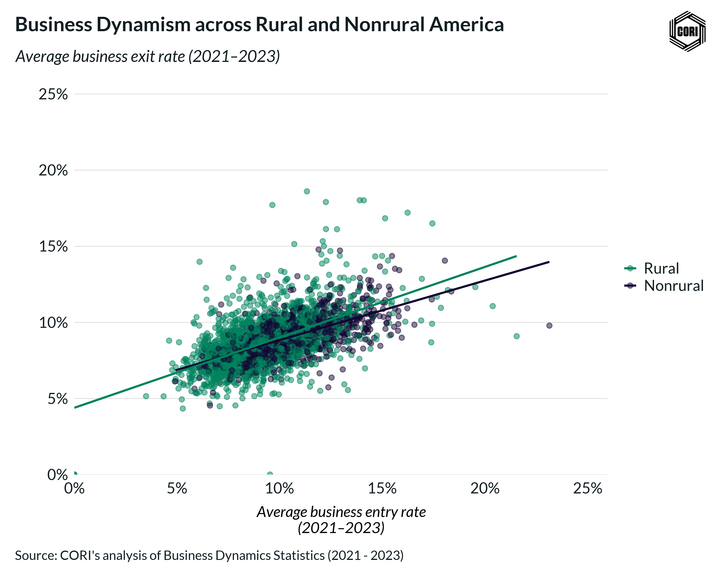
High business entry and exit rates signal an environment open to innovation, experimentation, and risk-taking. Business exit rates, however, can be more context-dependent. In economically distressed counties, elevated exit rates often occur without offsetting entry or growth. In entrepreneurial counties, by contrast, business exit rates tend to rise with strong business entry, job creation, and innovation, reflecting experimentation and risk-taking, and the reallocation of resources to more productive uses.7 Business exits can be valuable learning experiences that inform and strengthen future entrepreneurial ventures. In some cases, exits even reflect success, such as when a growing business is acquired and reclassified under new ownership.8,9 As business entry rates increase, business exit rates also tend to increase, though to a lesser extent (Figure 1). Dynamic places churn, but they also tend to grow.
Self-employment is another important lens on entrepreneurship in rural communities. Most entrepreneurial journeys start small, often with one person testing an idea on the side before transitioning into full-time self-employment and eventually formalizing a business. Self-employment rates capture the extent to which people in a community are working for themselves and reflect underlying entrepreneurial capacity, whether driven by opportunity and high-growth founders or individuals turning to self-employment out of necessity.10
Necessity and Opportunity Entrepreneurship
Entrepreneurship is commonly characterized by the motivations that lead individuals to start businesses, including both necessity-driven and opportunity-driven pathways.11 These motivations are not mutually exclusive and can emerge in any community, though opportunity-driven entrepreneurship tends to concentrate in and benefit from growing or emerging markets, where entrepreneurs identify unmet demand and launch businesses with the potential for innovation and sustained growth. An illustrative example is Ludare, in Portsmouth, Ohio (Scioto County). Founded by game designer Matthew Stone in 2024, Ludare provides a platform that enables independent game developers to get their games to market faster, which in turn helps them to raise funds for further development in a tight and competitive market. While still small, Ludare has potential for scalable growth and functions both as an enterprise and a support for other entrepreneurs.
Necessity entrepreneurship, by contrast, often emerges when individuals have fewer labor-market alternatives, a circumstance more common in rural communities, particularly those that are more geographically isolated or working to adapt or facing persistent economic challenges. Entrepreneurship has been shown to provide a more flexible work alternative to other forms of employment, especially for individuals facing barriers to employment, including those with caregiving responsibilities.12 Both opportunity and necessity entrepreneurship matter, as they help reveal a community’s resilience, adaptability, and propensity to self-organize in response to local opportunities or challenges.13
Case Study: Revitalization Through Necessity, Growth Through Opportunity
A powerful example of the transformative impact that necessity entrepreneurship can have comes from Hamilton, Missouri14, home to the Missouri Star Quilt Company. Founded in 2008 by the Doan family after financial hardship and job loss, the business began as a small quilting service to earn money from Jenny Doan’s hobby in a small rural town. When the family started posting free quilting tutorials on YouTube, founder Jenny Doan became an unexpected quilting figure, drawing online customers and eventually visitors from across the country. Missouri Star reinvested its growing online sales into renovating empty downtown buildings, creating a cluster of themed quilt shops, classes, and retreats that transformed Hamilton into “Quilt Town, USA.” Today, the Missouri Star Quilt Company employs over 400 people (in a town of less than 2,000 people), and tens of thousands of tourists visit the town each year. Rather than triggering a population boom, Missouri Star Quilt Company appears largely to have provided good local jobs, allowing many residents and nearby rural workers to stay employed in their hometown instead of commuting long distances or relocating – an important dimension of rural revitalization. This illustrates how digital tools and local investment can transform necessity entrepreneurship into opportunity entrepreneurship and spark rural revitalization that keeps wealth local.15
Measuring Innovation
A robust entrepreneurship ecosystem is defined not only by business formation and exit or self-employment rates, but by its ability to support businesses across the full lifecycle of growth—from pre-seed and seed stages through startup, scaling, and long-term expansion. Measures of innovative focus on whether local ecosystems enable businesses to develop new technologies, attract capital, create jobs, and grow into durable, scalable enterprises.
Indicators such as patent activity, venture capital investment, and job creation capture this innovative and growth-oriented dimension of entrepreneurship. At the early stage, many innovative rural founders are leveraging technology to modernize essential industries and working to attract capital to help them scale.16 For example, rural startup BOPA Precision Agriculture, founded in La Junta (Otero County, Colorado) in 2017, has raised nearly $2 million to develop autonomous farm robotics that help small and mid-sized producers plant and weed more efficiently, bringing advanced technology to markets often overlooked by traditional ag-tech investment. Similarly, Soiltech Wireless, founded in Rupert (Minidoka County, Idaho) in 2019, has filed patents for rechargeable wireless sensors that monitor moisture, temperature, and other crop conditions, helping growers reduce waste and increase yields. Lightcast (formerly Emsi), founded in Moscow, Idaho (Latah County) in 2001, exemplifies a startup in a later stage of the entrepreneurial lifecycle. Now a global leader in labor market analytics, Lightcast is a high-growth, tradeable services firm that has remained rooted in its rural community, providing a durable base of high-wage jobs, technical expertise, and local economic spillovers. These businesses illustrate how innovative rural businesses are emerging across communities at different stages of ecosystem development, translating challenges into scalable solutions.
Together, these examples also demonstrate that rural entrepreneurship spans a complete lifecycle—from pre-seed and early-stage startups in emerging innovation hubs such as Otero County, Colorado, to anchor firms in more established innovation hubs such as Latah County, Idaho. Measuring innovation and growth, therefore, requires capturing both the creation of new ideas and the capacity of businesses to scale, ensuring that entrepreneurial success is reflected not only in startups but in businesses that grow, persist, and contribute to long-term rural prosperity.
Case Study: Building a High-Growth Ecosystem

Bozeman, the county seat of Gallatin County, Montana, is an illustrative example within a predominantly rural state of how a high-growth entrepreneurship ecosystem can emerge from a rural community and mature over time. For more than a decade, Bozeman has exhibited an alignment of entrepreneurial indicators: high establishment entry and exit rates, high self-employment, meaningful patent and innovation activity, and sustained venture capital investment. Gallatin County outpaces many of its rural peers in business ownership. The county’s self-employment rate sits at 17%, well above the rural national average of 12%. This suggests a strong and sustained culture of independent business creation, where entrepreneurship is not just an economic activity, but a common career path. Bozeman has sustained business establishment entry rates above the national average for decades with startup rates increasing since 2010 (Figure 2). Investment activity tells a similar story: venture capital funding reaches $1,658 per capita, more than double the U.S. average.17 Together, these indicators point to a local economy where new ideas are not only starting, but scaling.
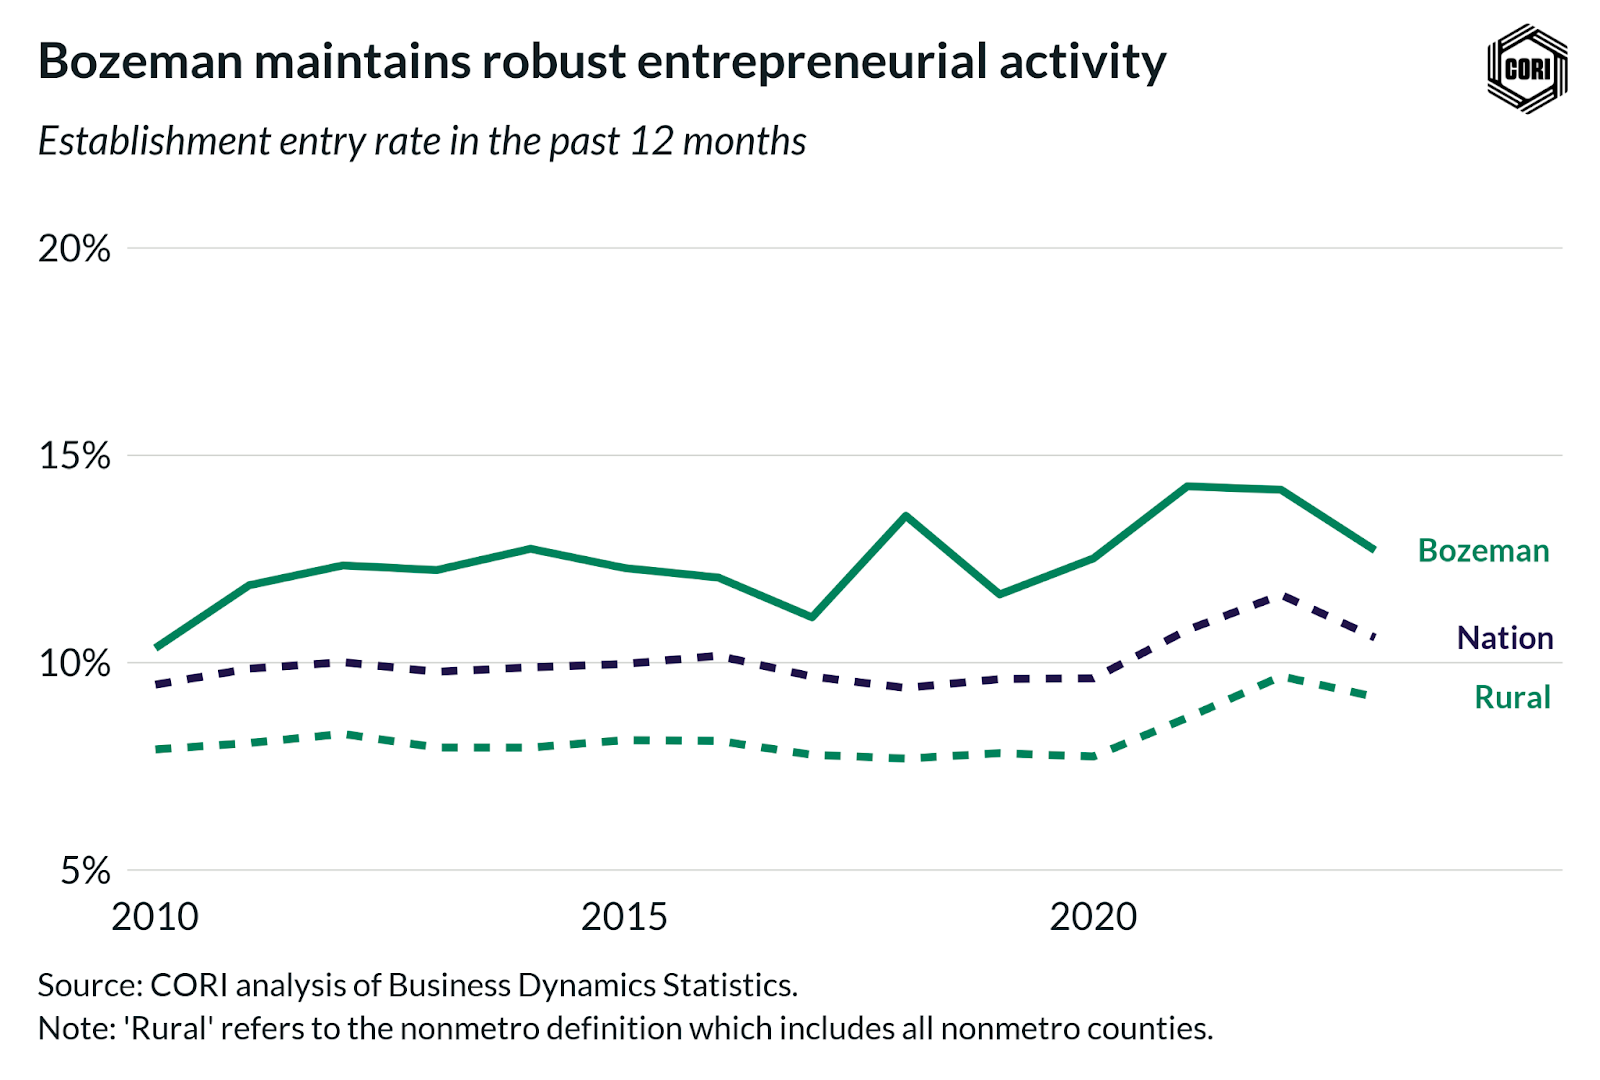
Sustained establishment entry compounds over time, driving growth in the total number of businesses even as establishment exits remain elevated. Between 2010 and 2022, the total number of businesses in the county rose by 41% — nearly four times the national growth rate of 11% (Census BDS).
Long before the emergence of high-growth tech firms, entrepreneurship in the Bozeman region was already shaped by founders who leveraged local assets—land, agriculture, and community to build durable businesses rooted in place. The Folkvord family offers a clear example of this earlier entrepreneurial foundation. Beginning with farming and wheat production in Montana, the family expanded into value-added entrepreneurship by opening a bakery in 1990, later growing Wheat Montana into a well-known regional brand. Over time, their entrepreneurial activity extended beyond agriculture into investment in Bozeman’s local hospitality and food economy, including ventures such as The Farmer’s Daughters Café, which emphasizes local sourcing, Montana-grown ingredients, and community gathering. This form of asset-based entrepreneurship, grounded in natural resources, local supply chains, and place-based identity, helped establish a culture of business ownership and reinvestment that predated Bozeman’s tech-driven growth and laid important groundwork for the region’s later entrepreneurial evolution.
Researchers studying Montana’s entrepreneurial ecosystems found that Bozeman demonstrated “a very high level of entrepreneurship measured by macroeconomic Census data, spinoff activities, high-growth companies, and private-equity investments”.18 One of the catalysts for this ecosystem is credited to the founding of RightNow Technologies in 1997. Its founder, current Montana Governor Greg Gianforte, chose to locate the company in Bozeman while the town was still distinctly rural, explaining at the time that “We had this idea that the internet removed geography as a constraint. When we started, that was a theory; it wasn’t a fact.”19 RightNow grew to employ more than 1,100 people before its $1.8 billion acquisition by Oracle in 2012. Former RightNow employees have gone on to launch 16 additional companies – most located in Bozeman – across multiple sectors. Several firms were backed by more than $7 million in follow-on private investment, seeding a new generation of founders and strengthening Bozeman’s entrepreneurial pipeline.20 Notably, two-thirds of these companies are still operating and still located in Bozeman. Business spin-offs are common elements in self-reinforcing entrepreneurial ecosystems.21
While Bozeman’s population growth during the pandemic contributed to its reclassification as a metropolitan area in 2023, the underlying dynamics – talent attraction and housing pressures – mirror challenges emerging across many high-amenity rural communities.22 Yet despite this formal shift in classification, Bozeman appears to have retained many of the characteristics that shaped its early success: a strong sense of place, close ties between businesses and the community, and an ecosystem that supports entrepreneurship across the full business lifecycle.23 The Western Cafe, a Bozeman institution housed in one of the city’s oldest surviving structures from the 1870s, evokes the town’s past as a ranching community. Antique rifles, horseshoes, and other ranching paraphernalia hang from its knotty pine walls, and a row of small plaques behind the service counter displays the cattle brands of area ranches. At the counter, grizzled old regulars rub elbows with young Montana State University students and tourists. The Western remains a place where the past is preserved, newcomers are welcomed into it, and the spirit of Montana endures. Today, Bozeman illustrates how rural-rooted communities can generate sustained, high-impact entrepreneurship without losing their connection to place.24

How the Rural Entrepreneurship Index is Constructed
The Rural Entrepreneurship Index brings together multiple dimensions of entrepreneurship to provide a comprehensive picture of entrepreneurial activity and capacity across rural counties. Specifically, the Rural Entrepreneurship Index captures three core pillars:
- Business dynamism (how often businesses start and also close)
- Innovation and growth (the degree to which businesses generate patents, attract investment, and create jobs),
- Entrepreneurial capacity (how many people work for themselves).
Together, these pillars offer a picture of how entrepreneurial a rural community is.25
The Rural Entrepreneurship Index powers a practical, data-driven map of rural entrepreneurship—one that allows communities to see where they are on their entrepreneurial journey and assess some of their strengths and gaps. Each group of indicators offers different lenses through which communities can assess their entrepreneurial ecosystems. To construct this map, all indicators are first standardized to allow meaningful comparison and combination into a single, interpretable measure.
We use a statistical technique called principal component analysis (PCA) to integrate the eleven underlying entrepreneurship indicators or components into one index (see the appendix for a more detailed explanation of the data and methodology).26 In simple terms, PCA identifies the shared pattern across indicators and assigns weights based on how much each measure contributes to differences in entrepreneurial activity across counties. For example, in entrepreneurial places, higher business entry rates often coincide with stronger job creation, reflecting environments where new firms are forming and expanding. PCA captures this co-movement across counties, allowing both business creation and job creation to contribute positively to the index when they align with the dominant entrepreneurial dynamics observed across rural communities. As a result, the index synthesizes these metrics into a single composite score, designed to reflect the broad trends of entrepreneurial activity that no single indicator can capture alone.
Accounting for Outliers
When working with national data, extreme outliers—such as Silicon Valley or Austin—can distort standard PCA results by disproportionately influencing the estimated weights.27 For instance, Silicon Valley’s exceptionally high concentration of venture capital investment may dominate the statistical relationships in a standard PCA, inflating the weight placed on venture capital even though this pattern may be less representative of entrepreneurial activity across rural counties. To address this, we employ a robust principal component analysis that limits the influence of such outliers and anomalies and allows us to extract the dominant patterns of entrepreneurship relevant to rural counties. Using a national sample ensures the index reflects the conditions that support entrepreneurship at scale, including factors that rural communities may aspire to strengthen over time, such as access to venture capital.28 Robust PCA preserves this broader context while constructing a rural-relevant index, enabling meaningful comparisons across rural and nonrural places.29
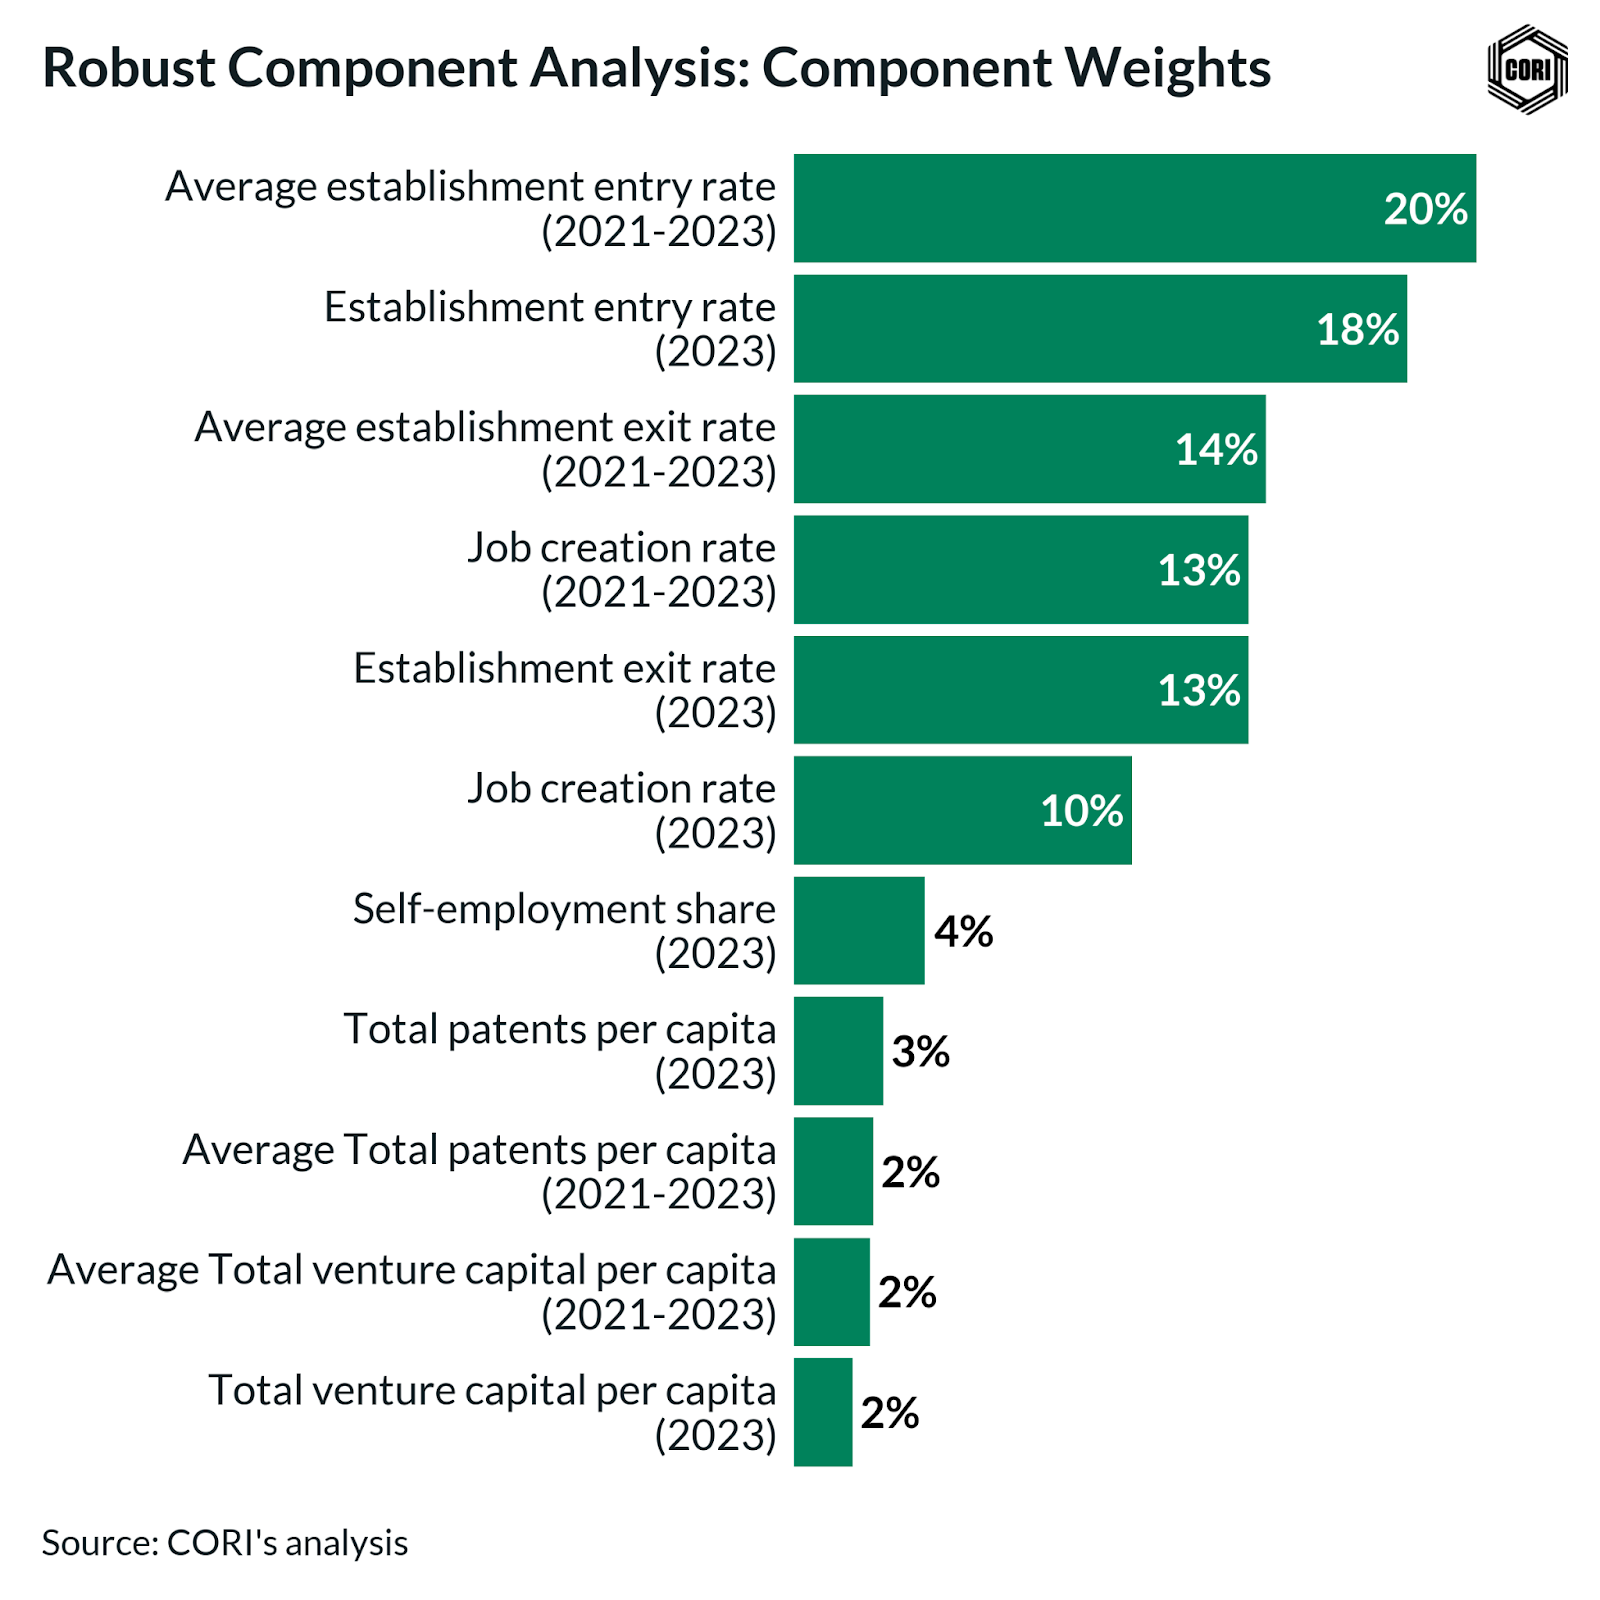
Each indicator is weighted by the extent to which it explains variation in entrepreneurial activity across counties. Figure 3 shows the relative contribution of each indicator to the Rural Entrepreneurship Index. We include both the most recent year of data and three-year averages.30 The combined approach lets the index reflect both current momentum and sustained performance, creating a more reliable and stable index.31 We would expect sustained establishment entry rates to be among the most determinant measures of entrepreneurship in a county. Indeed, the average establishment entry rate (2021-2023) is the most highly weighted at 20%. Business dynamism indicators—establishment entry and exit rates—together account for the majority of the index’s weight, followed by job creation rates. Patents and venture capital, while crucially capturing innovation and growth potential, receive less weight, consistent with the robust method’s reduction of outlier influence from a small number of high-investment nonrural counties. The result is an index that is statistically rigorous, stable over time, and highlights both everyday entrepreneurship and the conditions that support high-growth, innovative firms.32
Bozeman (Gallatin County) is already widely recognized as an entrepreneurial place.33 Gallatin County ranks in the 98th percentile of the Rural Entrepreneurship Index, meaning that this region performs better than 98% of all counties when considering the eleven indicators in the index. Gallatin’s strongest indicators are its 3-year average establishment entry rate (14%), 3-year average establishment exit rate (10%), and 3-year average job creation rate (18%), which exceed the average for all rural and nonrural counties between 2021 and 2023.
Identifying Emerging Ecosystems
The Rural Entrepreneurship Index also highlights rural regions whose entrepreneurial strengths are well known locally but less recognized nationally because their ecosystems are still emerging. One such example is Durango, Colorado (La Plata County), a member of CORI’s Rural Innovation Network. La Plata County ranks in the 89th percentile of all counties overall, driven primarily by strong business dynamism: its 11% establishment entry rate exceeds the average for rural counties in 2023 as well as its own performance from 2021 to 2023, and both its job creation and business exit rates also contribute meaningfully to its high score. Durango is home to businesses like Agile Space Industries, founded in 2009, which has grown to more than 100 employees, has attracted roughly $19 million in venture capital, and has built a patent portfolio covering key elements of its propulsion technology. What makes La Plata County stand out is the consistency of entrepreneurial activity across indicators: self-employment rates exceed 19% (compared with 13% in rural counties using the ACS 5-year average in 2023), business formation and job creation regularly outpace rural national averages, and per-capita private investment is nearly three times higher than that of rural counties overall. No single metric captures this trajectory fully, but taken together, they show the pattern of a rural community where entrepreneurship is reshaping the region’s economic future.

Using the Rural Entrepreneurship Index for Future Growth
The Rural Entrepreneurship Index helps counties understand where they stand relative to their peers using the overall score, but more importantly, the underlying measures pinpoint community strengths and opportunities to improve the business dynamism, entrepreneurial capacity, and innovation and growth potential of their local economy. By helping communities see where they stand and what’s driving their entrepreneurial capability, we can begin to identify the conditions that help rural innovators thrive. For example, a county with strong business entry rates but low venture capital activity might focus on connecting local founders to regional capital networks, while a county with high self-employment but low job creation might prioritize support for scaling existing businesses.
And as new data becomes available each year, the index can be updated, allowing policymakers, economic developers, and residents to track their progress toward building more dynamic, resilient local economies. This tool is a practical, empowering resource built for rural leaders, founders, investors, philanthropies, policymakers, and residents who want a clearer picture of their local entrepreneurial ecosystems, offering a snapshot of each community’s position on its path to a thriving entrepreneurial ecosystem. To reach its full potential, entrepreneurship must be an accessible and supported pathway for all rural residents. In the months ahead, we’ll be releasing a companion report that digs deeper into the conditions of place, the community capitals and local assets that are most strongly associated with entrepreneurial rural economies.34 Together, these insights will help communities not only understand where they stand, but what they can do to strengthen their entrepreneurial ecosystems.
Appendices:
Appendix A: Rural Entrepreneurship Indicators
The Rural Entrepreneurship Index is constructed using county-level indicators from entrepreneurship research that capture both the rate and the magnitude of entrepreneurial activity. For this analysis, rural counties are defined using the Office of Management and Budget’s nonmetropolitan county classification, which is widely used in rural research to ensure consistent, county-based comparisons of economic and demographic conditions. The entrepreneurship indicators, detailed below, collectively serve as observable proxies for underlying business dynamism, innovation and growth, and entrepreneurial capacity at the county level.
To capture both recent and sustained entrepreneurial activity while reducing noise, each indicator—except for self-employment share—is smoothed using a three-year window, implemented as either a three-year average (establishment entry and exit rates and job creation rates) or a three-year sum (venture capital dollars and patent counts), alongside its latest annual value. This multi-year smoothing stabilizes year-to-year fluctuations, particularly in small counties where per-capita or percentage-based measures can be volatile due to small denominators, thereby producing more reliable inputs for principal component analysis. While 3-year estimates are not possible to calculate for each county’s self-employment share due to data limitations, American Community Survey (ACS) 5-year estimates still allow us to mitigate year-to-year fluctuations that would come from a more granular measure.
Before conducting principal component analysis, each indicator is standardized using a z-score transformation (subtracting its mean and dividing by its standard deviation). Standardization places all variables on a common scale, ensuring that indicators measured in different units or exhibiting different levels of variance can comparably contribute to the component structure. This prevents variables with inherently higher variance—such as patent counts, capital raised, or even establishment entry rates—from disproportionately influencing the resulting components.
Establishment Entry Rate:
The establishment entry rate is calculated by the U.S. Census Bureau’s Business Dynamics Statistics. The BDS establishment entry rate is calculated by dividing the number of newly created establishments in year t by the average number of active establishments in years t and t–1. We include the most recent establishment entry rate data for 2023 separately from the average establishment entry rate for 2021, 2022, and 2023.
Entry Ratet = Establishment Birthst / (0.5 * (Total Establishmentst + Total Establishmentst – 1 ))
This indicator captures how much new business creation is happening in the economy, which is important as a measure of overall entrepreneurial dynamism. A higher establishment entry rate corresponds to higher rates of startup activity and business formation, suggestive of a dynamic and competitive market. Lower values, on the other hand, are more indicative of a relatively more risk-averse or slow-growing business environment. This measure is especially important because new businesses play a large role in contributing to job creation and productivity growth.35
Because entrepreneurship is a geographically rooted activity, and because establishments generally reflect where economic activity actually occurs, establishment-level data provide a more accurate and spatially relevant measure of entrepreneurial dynamism than firm-level data, particularly in rural counties where most businesses are single-establishment.36
Establishment Exit Rate:
The establishment exit rate is calculated by Business Dynamics Statistics and follows the same logic as the entry rate above, where the number of establishments exiting the market in a given year t is divided by the average total number of establishments that year and the previous year. We include the most recent establishment exit rate data for 2023 separately from the average establishment entry rate over the years 2021, 2022, and 2023.37
Establishment exit rates similarly capture an important component of entrepreneurial dynamism and are often assessed alongside an area’s establishment entry rate. Higher establishment exit rates are indicative of greater market turnover, which can be interpreted differently depending on context. Higher establishment exit rates can correspond to market disruptions and/or an environment of greater market competition and dynamism. In these contexts, higher exit rates can indicate a willingness to take risks and learn from experience, both of which are central to a healthy entrepreneurial ecosystem. A lower value is generally associated with a relatively more stable market where turnover is lower. On average, establishment entry and exit rates generally move together, meaning that greater entry and exit rates tend to correspond to a healthier entrepreneurial environment (see Figure 1).
We include establishment entry and exit rates as separate indicators rather than using net establishment growth (entry minus exit) because each captures a distinct and meaningful dimension of entrepreneurial dynamism. Net growth is a simple algebraic combination of these two measures and adds no independent information; treating entry and exit separately allows the principal component analysis to identify richer patterns in how entrepreneurial ecosystems differ across counties.
This distinction is especially important in the Rural Entrepreneurship Index as rural communities have increasingly turned to entrepreneurship and self-employment to maintain livelihoods and build economic resilience during times of uncertainty and to mitigate the impacts of larger structural headwinds.38 Capturing both business formation and business loss separately allows the index to reflect this dual reality: rural places may simultaneously face elevated exits and rising entrepreneurial activity, each telling a different part of the story.
Job Creation Rate:
The job creation rate is calculated by Business Dynamics Statistics and follows the same logic as the entry and exit rates above, where the number of new jobs added by expanding and new establishments between year t-1 and t is divided by the average employment in years t and t-1. We include the most recent job creation rate data for 2023 separately from the average establishment entry rate for 2021, 2022, and 2023.
Tracking an area’s job creation rate helps measure the degree of innovation and growth occurring through both business expansion and new businesses entering the market. The higher the value, the more likely that an area’s businesses are successfully scaling and contributing to economic expansion. A low value might suggest a relatively more sluggish entrepreneurial environment where new businesses are either not forming or not growing as much.
Self-Employment Rate:
The self-employment rate is calculated by dividing the American Community Survey’s 5-year estimates of the number of self-employed individuals in the county by the total working-age civilian population in 2023.
Given how most entrepreneurial journeys start small, estimating an area’s self-employment rate is important for capturing its underlying entrepreneurial potential. If more people are starting their own business, whether out of opportunity or necessity, this is generally indicative of entrepreneurial capacity. Even when self-employment is driven more by necessity due to economic distress or barriers to employment elsewhere, it still reflects a strong underlying culture of entrepreneurship and resiliency that can help an area recover. Entrepreneurial capacity in response to opportunity indicates that self-starters have better access to the resources and networks necessary to take risks and test new ideas. Therefore, higher self-employment rates correspond to a stronger entrepreneurial environment, where innovation and risk-taking can lead to greater income growth potential in expanding and recovering regions.
Patent Intensity:
Patent data comes from the U.S. Patent and Trademark Office database, which aggregates patent counts for applications and granted patents. We include the most recent patent data for 2023 separately from the average total patents per capita for 2021, 2022, and 2023. Using a per-capita measure adjusts for large differences in county population size and allows the index to capture the intensity of innovation activity rather than the sheer volume of patents, which would otherwise be dominated by more populous counties.
Per capita patent counts capture a region’s innovation intensity and technological progress, as measured by the number of legally protected new inventions or designs granted to individuals or companies. Higher values usually correspond to an innovative, knowledge-intensive economy with high potential for future growth.39 Conversely, lower values suggest a slower pace of technological change and innovation, which may also correspond to lower R&D investment.
Venture Capital Intensity:
Venture capital data comes from the Internal Revenue Service’s Schedule D filings.40 This form is used to report capital gains and losses from the sale or exchange of capital assets, which include gains realized from venture capital investments. For this indicator, we divide the total venture capital in a county by the area’s total population to capture the intensity of venture capital investment. As with all prior indicators, we calculate this for 2023 and for the period from 2021 to 2023.
Venture capital is a form of private equity that provides funding to early-stage, high-growth potential companies in exchange for equity or partial ownership. Entrepreneurship requires risk-taking and testing innovative new ideas, and venture capital investment is one powerful way to scale. A county that attracts more venture capital tends to have a more innovative ecosystem with high growth potential.
Together, these variables capture a broad but salient view of entrepreneurial activity: business formation, business churn, job creation, and innovation through patents and venture capital.
Appendix B: Methods
The Rural Entrepreneurship Index is constructed utilizing robust Principal Component Analysis (PCA) to reduce multiple indicators into a single composite measure. The index and its component weights, as presented in Figure 3, are derived from the robust PCA methodology described below. We also estimate traditional and kernel PCA variants as robustness checks; these alternative approaches confirm that the index structure is stable and reliable across methods.
By design, this approach emphasizes the common variation across these measures. For example, establishment exit rates load onto the principal component only to the extent that they co-vary with other indicators, which in this framework are interpreted as signals of entrepreneurial dynamism, such as establishment entry rate. Consequently, exit rates are intended to contribute to higher index values in counties where they align with this broader pattern (see, for example, Figure 1). This formulation seeks to balance the influence of indicators, allowing the index to distinguish what the model identifies as healthy entrepreneurial churn from isolated economic contraction. The result is a composite measure that approximates rural entrepreneurship based on the selected indicators, capturing meaningful variation across U.S. counties.
The sections below describe each of the three PCA approaches estimated and the rationale for selecting the robust PCA specification as the primary index that underlies the Rural Entrepreneurship Index map:
- Robust Principal Component Analysis (Hubert, Rousseeuw, & Vanden Branden, 2005; Hubert, Rousseeuw, & Verdonck, 2009)
- Traditional Principal Component Analysis (Jolliffe, 2002; Jolliffe & Cadima, 2016)
- Kernel/Nonlinear Principal Component Analysis (Schölkopf & Smola, 1998)
Robust Principal Component Analysis
The Rural Entrepreneurship Index employs robust principal component analysis to produce a statistically grounded measure that is not distorted by the wide variation in economic structure across U.S. counties. Standard statistical methods are highly sensitive to extreme observations, creating two challenges for rural-focused analysis: first, the outsized influence of high-performing nonrural hubs can skew results toward patterns unique to coastal innovation centers; second, the small denominators common in very small counties can cause modest changes in business counts to appear as large percentage swings, introducing volatility that obscures underlying trends.
Large Nonrural Innovation Hubs
Major metropolitan innovation centers—such as Silicon Valley or Austin—exhibit levels of venture capital investment, patenting, and firm scaling that are orders of magnitude larger than those observed in most rural counties. For example, while the national average three-year venture capital intensity is approximately $264,430 per capita, nonrural outliers reach values as high as $11.8 million per capita.41 In a standard principal component analysis (PCA), these extreme values can dominate the data’s covariance structure, giving indicators associated with large coastal hubs disproportionate weight and pulling the index toward patterns that are not representative of rural entrepreneurial environments.
At the same time, including these counties remains important. They provide information about the full range of entrepreneurial activity in the U.S. and allow rural counties to benchmark themselves not only against peer rural places but also against more mature ecosystems. The methodological challenge is therefore not exclusion, but ensuring that these extreme values inform rather than distort the measurement of entrepreneurship in rural contexts.
Very Small Rural Counties
At the opposite end of the distribution, many rural counties have relatively small populations and few establishments. In these contexts, modest numerical changes—such as a small number of business openings or closures—can translate into large percentage changes in key indicators. This volatility is particularly evident in rate-based measures such as job creation or business entry. In 2023, for example, while the national average job creation rate was approximately 12.9 percent, some rural counties exhibited rates approaching 99 percent. Similarly, per-capita innovation measures, such as patents, show very high variance in the smallest counties, ranging from near zero (0.0001) to 0.07. These numbers vary sharply in relation to the national average of 0.0014 (140 patents per 100,000 residents).42
These small-denominator effects can cause a standard PCA to overweight idiosyncratic fluctuations in very small counties, obscuring broader, generalizable patterns of entrepreneurship across rural areas.
To address these issues, the robust PCA employs a high-breakdown estimator to limit the influence of observations with extreme leverage, whether arising from exceptionally large nonrural hubs or highly volatile small rural counties, while preserving the dominant structure of shared variation across the broader sample. Rather than allowing a small number of extreme cases to determine the component orientation, the method emphasizes patterns present in the majority of counties.43
Operationally, the procedure identifies observations most consistent with the central data structure and estimates components using a robust covariance measure. This process is iteratively refined to further reduce the impact of extreme values. As a result, the robust PCA:
- Downweights high-leverage or extreme observations
- Maximizes variance relative to the robust (outlier-resistant) scatter
- Produces components that reflect generalizable entrepreneurial dynamics rather than idiosyncratic extremes
Because robust PCA is less sensitive to the extreme observations described above, its estimated component weights more accurately recover the shared principal component subspace—the dominant pattern of co-movement across indicators that collectively capture entrepreneurial activity—that both robust and traditional PCA target.44 Component weights from the robust specification are therefore reported in Figure 3, as they correspond to the weights used to generate county-level index scores.
The outcome is a principal component estimated from a robust covariance structure that produces county rankings highly consistent with a traditional PCA, is more stable across a heterogeneous sample, robust to extreme outliers, and more interpretable than more complex nonlinear alternatives. In effect, this approach allows us to characterize broad entrepreneurial patterns across counties and to assess which underlying indicators contribute strongly to entrepreneurship.
The final index score for each county is derived from a linear combination of the 11 standardized indicators, where each value is multiplied by the data-driven loadings from the robust principal component and summed to produce a raw score representing the county’s position along the underlying entrepreneurship dimension. For ease of interpretation, these scores are transformed into percentile ranks, yielding an ordered distribution from the 1st to the 100th percentile. Higher percentiles indicate stronger entrepreneurial environments than those of other counties.
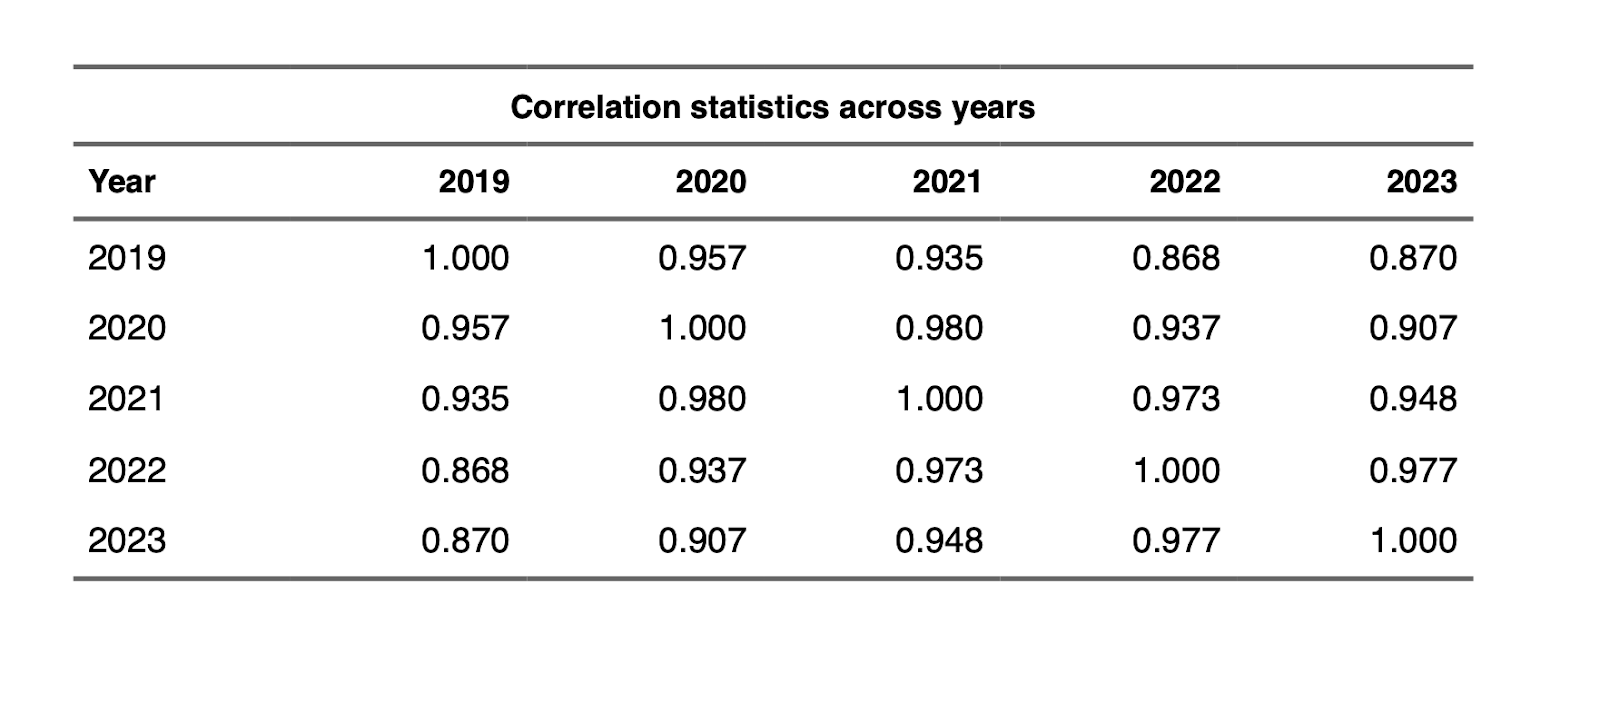
To ensure the index reflects durable entrepreneurial conditions rather than short-term volatility, we estimate a robust PCA using single-year data for 2019–2023 and examine cross-year correlations. The resulting indices are highly correlated over time, with the strongest correlations between adjacent years, indicating temporal stability and gradual evolution rather than noise-driven fluctuation (see Figure B1).
Robustness to Alternative PCA Specifications
We assessed the sensitivity of the index to alternative component estimators by comparing traditional PCA, robust PCA, and a nonlinear kernel PCA. Despite methodological differences, all approaches produced highly similar score distributions and county orderings. For example, the correlation between the kernel and robust specifications is very strong (Pearson r = 0.916; Spearman ρ = 0.964), indicating that potential nonlinearities do not materially alter the dominant dimension of shared variation across indicators.
Kernel PCA generates greater dispersion at the extremes, but this primarily reflects rescaling rather than the emergence of substantively different patterns. Given the close agreement across methods, we retain the robust specification because it limits the influence of extreme observations while providing a stable and interpretable representation of entrepreneurial conditions.
Footnotes & Citations
- Henderson, 2002; Stephens & Partridge, 2011; Conroy, Kures, & Deller, 2019; Sablik, 2022
- Weinstein & Dewbury, 2025; Henderson, 2002; Stephens & Partridge, 2011; Conroy, Kures, & Deller, 2019; Sablik, 2022
- Fleming & Goetz, 2011; Nene & Abegaz, 2021
- The OECD, for example, measures entrepreneurship through various indicators including new business creation, business exit rates, and self-employment (Ahmad and Hoffman, 2008). Mojica et al., 2010 similarly measures entrepreneurship through various metrics including firm births, firm deaths, and self-employment. See Appendix A for more detailed information on the full list of indicators.
- Although “rural” can be defined in multiple ways, this analysis defines rural counties as those classified as nonmetropolitan by the Office of Management and Budget (OMB). This definition is widely used in rural economic research and provides a consistent, county-based framework for comparing economic and demographic conditions across the United States. Counties are also the finest geographic unit for which high-quality, comparable data are available across the entrepreneurship indicators included in the index.
- Acs & Mueller, 2008; Hathaway & Litan, 2014; Stephens & Partridge, 2011
- Yu, et al., 2009; Headd, et al., 2010
- For example, FNC and later Next Gear Solutions, technology companies founded in rural Oxford, Mississippi, that grew to serve national markets before being acquired by CoreLogic.
- Research also finds that startups with more failure-tolerant venture capital investors tend to be more innovative even after venture capital investors exit the IPO firms (Tian & Wang, 2009).
- Conroy, Kures , & Deller, 2019
- Fairlie & Fossen, 2020; Weinstein, Erouart, & Dewbury, 2024
- Barrios et al., 2024
- Stephens & Partridge, 2011
- Hamilton is in Caldwell County (with a population of less than 9,000) which is classified as a metropolitan county or nonrural due to the proportion of residents that commute to Kansas City (about 55 miles away). However, Hamilton itself is a small town of less than 2,000 people and is classified as a RUCA code 10 (Rural) This discrepancy highlights the difficulties presented by the numerous definitions of rural that are currently in use by researchers and policymakers and the limitations of data available at the county level but not lower levels of geography (Center on Rural Innovation, 2022).
- Adams, 201,8
- Weinstein & Dewbury, 2025
- CORI Economic Development Tool The national rate includes nonmetropolitan and metropolitan areas.
- Inc. Magazine produces an annual list of the fastest-growing companies in the United States. Motoyama et al., 2017, p. 4
- Van Wagenen, 2017
- Motoyama et al., 2017, p. 7
- Weinstein & Dewbury, 2025
- Blatchly, 2025; Hermann & Whitney, 2025
- Motoyama et al., 2017
- Henderson, 2002; Stephens & Partridge, 2011; Conroy, Kures, & Deller, 2019
- Detailed information on the data sources for these indicators is provided in Appendix A.
- See Appendix B or Greenacre et al., 2022 for an in-depth explanation of principal component analysis.
- Small rural counties can also appear as outliers. Even modest growth in the number of businesses can produce high establishment entry rates (percentages) when the community starts from a small base. Appendix B explains how the methodology addresses this in more detail.
- Weinstein & Dewbury, 2025
- We also tested alternative principal component analysis (PCA) methods to check whether the rural entrepreneurship index or county rankings were sensitive to different model specifications. For instance, we evaluated a traditional and kernel-based PCA designed to capture potential nonlinear relationships. The nonlinear method did not reveal meaningful curvature in the data and produced results nearly identical to the baseline model, indicating that model choice did not materially affect the index or rankings. Appendix B explains these findings further.
- Because of data availability, we use only the 5-year average for self-employment share from the ACS.
- The stability (or correlation) of the index over time, even when calculated using only current-year data, shows that this method captures real underlying entrepreneurial capacity, not random year-to-year noise.
- The analysis is based on the latest release vintage that’s available across all data sources: American Community Survey, Business Dynamic Statistics, SEC FormD, US Patent Office. Appendix B includes more information on the methodology used.
- Motoyama et al., 2017; Livability, 2017
- See Emery & Flora, 2006 for a discussion of the community capitals framework.
- Weinstein & Dewbury, 2025; Henderson, 2002; Stephens & Partridge, 2011; Conroy, Kures, & Deller, 2019
- See Census definition of an establishment; Sternberg, 2022
- Establishment exit rates in the BDS include both true closures (cessation of operations) and administrative exits resulting from ownership changes, mergers, acquisitions, or firm restructuring that cause an establishment to receive a new identifier. The data do not permit precise decomposition of exits by cause.
- Center on Rural Innovation, 2023
- Carlino & Kerr, 2015
- You can view more detailed information about Form D filings for each county from the Center on Rural Innovation, 2025.
- These estimates were produced using issuer-reported data from U.S. Securities and Exchange Commission Form D filings, which capture private capital raises conducted under Regulation D exemptions, for calendar year 2023.
- These estimates were produced using patent data from the U.S. Patent and Trademark Office, for calendar year 2023. This value reflects the sum of patents over a 3-year period divided by the total U.S. population.
- Because small counties (with small denominators) may have large percent changes from a modest increase in the number of establishments, one might also consider a population-weighted PCA. A population-weighted PCA stabilizes variance by reducing the influence of small-county noise, but it also risks overweighting the entrepreneurial structure of large, urban counties. Because the Rural Entrepreneurship Index is designed to reflect rural realities, we complement unweighted PCA with robust PCA to preserve rural-specific patterns while mitigating the influence of very large urban areas and very small counties that are extreme outliers.
- Hubert et al., 2005; Hubert et al., 2009