There is a phrase often used in the world of rural development: “If you’ve seen one rural community, you’ve seen one rural community.”
It reflects the fact that the parts of our country referred to as rural America are a vast geography — stretching from coast to coast — made up of varied places with unique histories, landscapes, and peoples. This reality makes it extremely difficult to settle on a single set of characteristics that encapsulate rural America. Even the people who live in areas referred to as rural often disagree on what makes a place rural.
![]() As we set off on this Rural Aperture Project, a multi-story series funded by the Robert Wood Johnson Foundation’s Thrive Rural initiative, in which we will use data to help people see the opportunities, challenges, and inequities of rural places in a new light, we face the difficult task of defining rural America.
As we set off on this Rural Aperture Project, a multi-story series funded by the Robert Wood Johnson Foundation’s Thrive Rural initiative, in which we will use data to help people see the opportunities, challenges, and inequities of rural places in a new light, we face the difficult task of defining rural America.
The challenges of definitions are felt by journalists, researchers, philanthropists, nonprofits, and governments who all rely on data to understand, make sense of, and make critical decisions about rural America and how resources are distributed. It can be tempting to shrug off the issue as too complicated to deal with, but doing so neglects the fact that the definitions we choose have real-world consequences — the ways that federal statistical agencies define rural have significant political and economic implications. Rural definitions affect the distribution of billions of dollars in federal funding each year, and shape the way that companies, banks, and philanthropies view communities and make investment decisions. We cannot separate the question of how rural America is defined from conversations around critical issues like education, health, racial equity, and economic opportunity in the U.S.
The goal of this story is not to argue that any one definition is best, but to show how these definitions impact narratives about rural America, as well as outcomes on the ground. We approach the issue from two perspectives:
- Demonstrating that using data based on different rural definitions can lead us to tell different stories about the state of rural America.
- Exploring how differences in definitions can create confusion about who is and isn’t eligible for federal funding that targets rural areas.
We hope that those who use data on rural America to tell stories, conduct research, distribute resources, make investments, or develop policy do so with greater awareness about how their choices define who is and is not counted, and with greater awareness of the impact of those choices.
Five major takeaways from this story:
-
No. 1
There are over a dozen federal definitions of “rural.”
Yet the two most readily accessible — the census rural definition and the nonmetropolitan rural definition — offer different conclusions about the population, demographics, and economic state of rural America. -
No. 2
The two most common definitions use different systems to determine “what counts” as rural.
The census definition measures population density, while the nonmetro definition measures economic and social relationships that span across cities and suburbs. -
No. 3
Looking at the people and places counted under each definition illustrates why they diverge.
Breaking down the definitions into small towns, open lands, and metro fringe areas highlights why rural definitions reflect different social and economic outcomes. -
No. 4
The nonmetro definition offers a better representation of diversity.
It also better represents social and economic ties across small towns and open lands. By contrast, the census definition groups together places that have different demographic and economic characteristics. -
No. 5
Rural definitions often disagree about what places should be considered rural.
When combined, the places that see the most disagreement account for 37.5 million people. This leads to confusion about access to programs and resources.
![]()
Two rural definitions, two very different stories
If you were to search the internet to find a count of the number of rural Americans, you’re likely to find two very different answers. In some cases, you might find the rural population is reported as 62 million people, and in other cases, it is reported as 46 million people. Each of these estimates is based on a different federal definition that classifies rural areas: the U.S. census’ urban/rural definition (known as the “census rural definition”), and the Office of Management and Budget’s (OMB) metropolitan/nonmetropolitan definition (known as the “nonmetro rural definition”), respectively.
These definitions are the most commonly used when analyzing data to understand rural America, employed by federal agencies, politicians, researchers, journalists, and others. While they are just two of more than a dozen federal definitions, they are usually the only options available when accessing demographic and economic data for rural areas from key federal agencies like the U.S. Census Bureau, the Bureau of Economic Analysis, and Bureau of Labor Statistics. As a result, these two definitions have shaped the way we understand and develop policy for rural America through data, and yet, they disagree on whether 15 million Americans should be counted or not.
These two definitions lead to significantly different pictures of rural America because the people and places are counted very differently: Less than half of the population under the census rural definition overlaps with the population under the nonmetropolitan definition (Figure 1).
Figure 1

The population size is not the only thing that differs across these two definitions.
If we focus on demographic data using the U.S. census definition (Figure 2), it appears that the rural population is growing, but is stagnant when using the nonmetro definition. If we consider the diversity of the rural population, the diversity score — the probability that two randomly selected people from the population are of different racial or ethnic groups — is 20% higher using the nonmetro rural definition than the U.S. census rural definition.
Figure 2

Similar patterns emerge when considering data on economic conditions: The rural economy appears to be growing and has low poverty rates when using the U.S. census rural definition, whereas the rural economy is lagging and poverty is a bigger issue when using the nonmetro rural definition.
In short, these definitions present two very different ways to think about the size, composition, and economic conditions of rural America, and each offers a different perspective. The U.S. census rural definition offers a more optimistic story, while the nonmetro definition paints a more sobering picture.
![]()
Which definition should we believe?
Our understanding of the story of rural America depends on the people and places we choose to count as rural. Which story resonates most with your understanding of rural America? Do you know who is being counted?
According to the census rural definition:
Rural America is thriving. Why aren’t more people talking about it?
Over the past decade, the story of rural America has largely been one of doom and gloom, when the reality is actually much brighter. Between 2010 and 2019, the population grew by 4%, while employment has grown by more than 6% in the past five years. Income per capita has grown in recent years, closing the gap with the rest of the country, and the percentage of the rural population below the poverty line has fallen, maintaining a level below the national average.
According to the nonmetro rural definition:
Rural America falls further behind the rest of the country
Over the past decade, rural America has fallen further behind the rest of the country. Employment has grown by just 2.5% in the past five years, as rural America still struggles to regain jobs lost during the Great Recession. Per capita income in rural America lags behind the rest of the country by more than 20%, and nearly 1 in 5 rural Americans live in a persistent poverty county. With few economic prospects, people continue to move away from rural areas, leading to stagnant population growth over the past decade.
![]()
Different systems for classifying rural areas
The reason why data can tell two completely different stories about rural America is because the census rural definition and the nonmetro rural definition use very different systems for defining what constitutes a rural place.
The U.S. census classifies the parts of the country considered as rural during each decennial census (Figure 3). The process begins by first classifying all the urban areas of the country using the smallest geographic unit used by the census — a block — which is roughly equivalent to a neighborhood block. The census definition of an urban area consists of areas with population densities of more than 500 people per square mile and places with more than 2,500 people. After defining all the urban areas, the U.S. census defines the rest of the country as rural. The types of low-population-density places counted as rural under the census definition range from farmland, to deserts, to forests, to suburban residential areas (Figure 4). The U.S. Census Bureau is the only statistical agency to use the term “rural” to classify the areas that are not considered urban, and as a result it is typically viewed as the official or default rural definition.
Figure 3

Figure 4

The nonmetro rural definition is based on the Office of Management and Budget’s (OMB) system for classifying regions according to social and economic relationships that span across cities and suburbs (Figure 5). While the census starts with the smallest geographic building blocks to classify areas, the OMB defines metropolitan areas using counties. Metropolitan areas revolve around a central city with a population of at least 50,000, and include neighboring counties that have strong social and economic links to the central city and surrounding suburbs, like through commuting patterns. Based on this system, there are 384 metropolitan statistical areas (MSA) across the country.
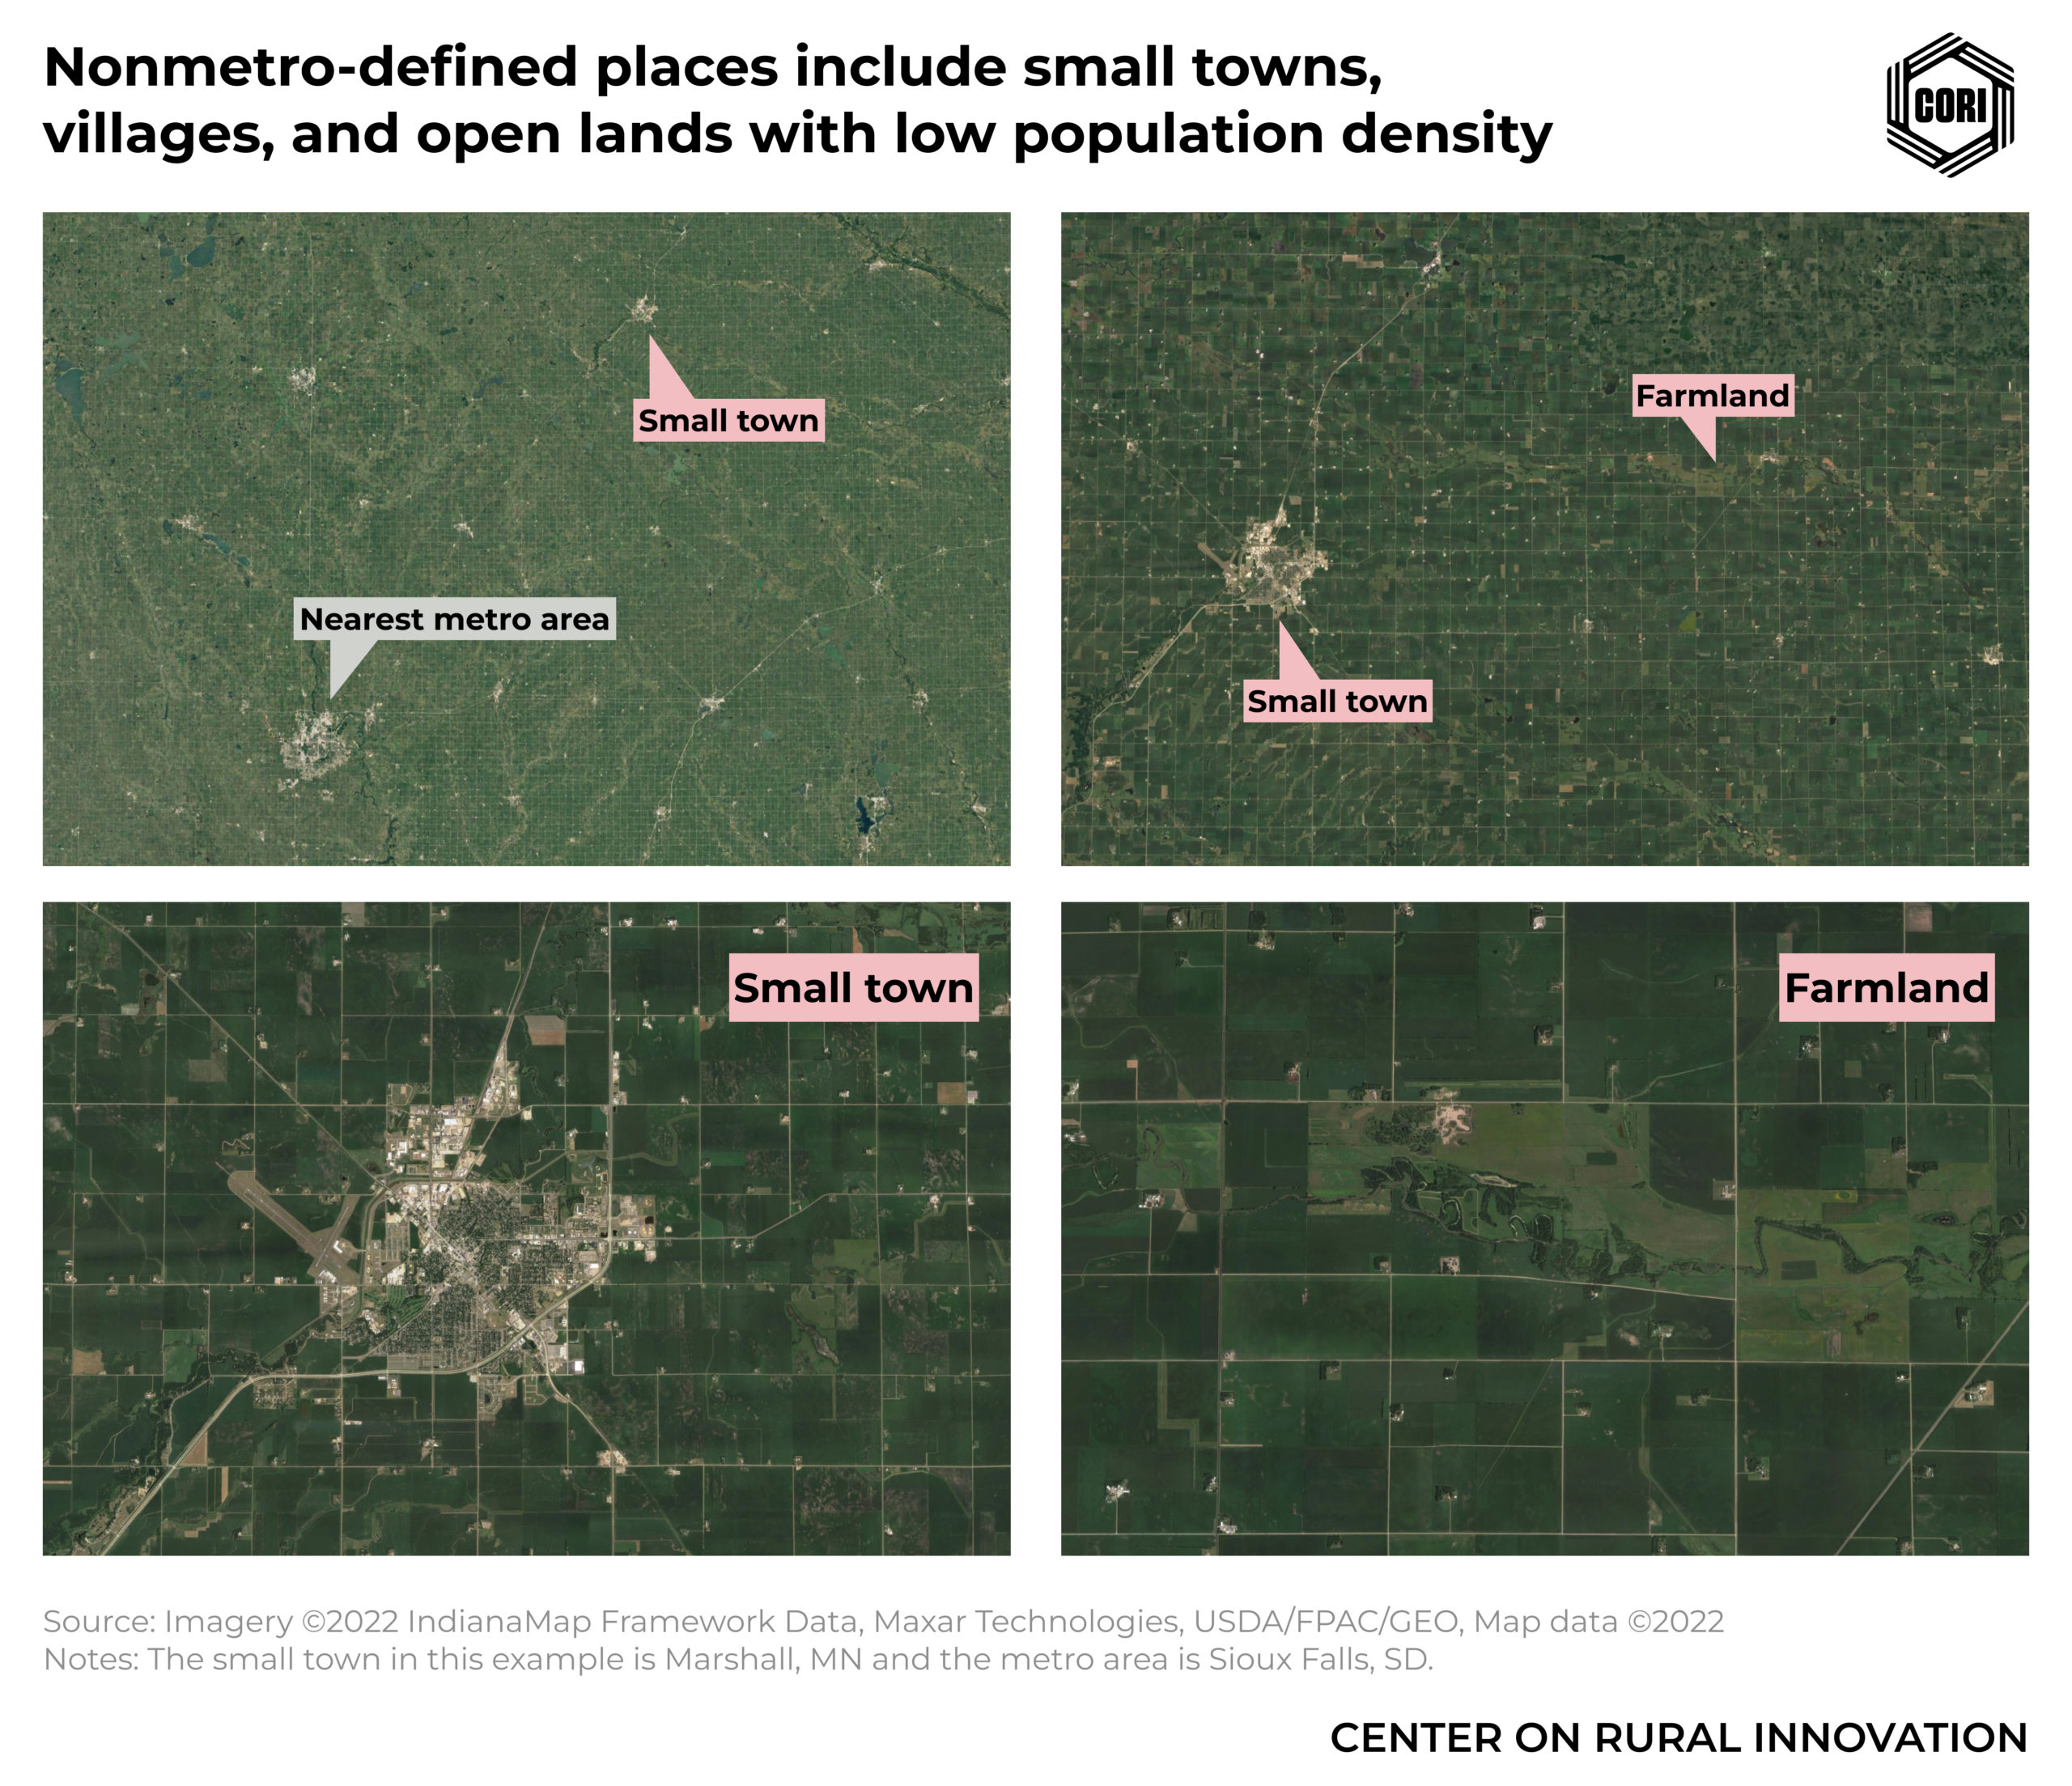
Similarly to the census definition, the areas that are not defined as MSAs — known as nonmetropolitan areas — are used by researchers and government agencies to define rural America. The types of places found in nonmetropolitan areas tend to take on one of two forms (Figure 6):
- Small towns and villages (with a population between 2,500 and 50,000). These areas often serve as centers for shopping, healthcare, education, and employment. Because small towns are defined as urban by the census definition, they are excluded from that population.
- Open lands with low population density, including farmland, forests, deserts, or mountains. These areas are classified as rural by the census definition.
Just as metropolitan areas describe the social and economic relationships between central cities and surrounding areas, nonmetropolitan counties also capture those dynamics, with small towns serving as micropolitan hubs for surrounding open land areas.
Figure 5

Figure 6
![]()
Breaking down the definitions
To understand why these definitions tell such contrasting stories, we have to look closer at the people and places counted under each. We can take the parts of the Venn diagram in Figure 1 and divide the pieces into three groups (Figures 7 and 8):
- Metro fringe, representing the low-population-density areas that fall within metropolitan areas. This is the part of the census rural definition that does not overlap with the nonmetro definition (the far left).
- Open lands, representing the low-population-density areas in nonmetro areas. These areas often include farmland or wilderness areas. This is the overlapping part of the Venn diagram and includes the areas classified as rural by both definitions (the center area).
- Small towns, representing the high-population areas that fall within nonmetro areas. This is the part of the nonmetro rural definition that does not overlap with the census definition (the far right).
Together, the metro fringe and open lands groups make up the U.S. census rural definition, while the open lands and small towns groups make up the nonmetro rural definition. The differences between the two definitions stem from the areas where the two definitions do not overlap.
Figure 7

Exploring where the populations within each group live reveals important insights into the differences in the places and people counted under each definition. Figure 8 maps the census and nonmetro populations using the breakdown from the previous section. The map shows that the populations under both definitions are heavily concentrated in the eastern half of the country — 86% of the census rural population and 84% of the nonmetro rural population live in the Northeast, South, and Midwest (how regions are defined). And while states in the West represent a large rural land area, they are more sparsely populated than states that are further east. Using either definition, national demographic and economic data on rural America is going to largely tell the story of people and places in the Midwest, South, and Northeast.
Figure 8
Across these three groups, the highest number of people live in metro fringe areas — places that are only considered rural by the census definition. Metro fringe areas represent a wide range of places, from farmland to suburban developments. Regardless of what they look like, the fact that these low-density areas fall within metropolitan areas means that the people who live there are more likely to be connected economically and socially to a larger regional economy, increasing residents’ access to a broader range of employment opportunities, healthcare, education, and other services. This is distinctly different from both the open lands and small towns outside of metropolitan regions, where access to economic opportunity and services are often more limited.
Specifically, the census rural definition is highly concentrated in metro fringe areas of the South (Figure 9), which represents a larger population than the entire census rural population living in the Midwest. This distinction is critical to understanding differences in the data. The South has experienced the fastest population and economic growth of any region of the country over the past 10 years. Consistent with suburban development, much of this growth has occurred in metro fringe areas. This dynamic contributes to the more optimistic story that emerges from data using the census rural definition
Figure 9

The data shows that over the last decade, population growth in areas defined by the census as rural has been largely in the metro fringe (Figure 10). Population in metro fringe areas grew by 8% — faster than the national average of 6.8%. On average, people in these areas experience significantly better economic outcomes than those living in open lands and small town areas.
Figure 10

When considering America’s small towns, the picture is nearly reversed.
Small town areas, which are only included as part of the nonmetro definition, experienced a population decline over the past decade. These areas are largely concentrated in the South and Midwest, which together account for 73% of the small town population. Employment grew by just 1% in the last five years. Per capita income is 30% lower than in metro fringe areas. The poverty rate is more than twice as high, and nearly 17% of the population lives in persistent poverty areas.
Small town areas represent a much more diverse population than the areas classified as rural by the U.S. census definition. In 2019, the diversity score in small town areas was 50% higher than that of metro fringe and open lands areas. As made clear in Figure 11, less than one quarter of the overall rural population lives in small towns, yet over a third of rural Black and Hispanic or Latino people reside in these towns. In short, while small towns are often left out of the story told by the census rural definition, they represent one of the most diverse portions of rural America (the second story in the Rural Aperture project will dig deeper into the issue of rural racial and ethnic diversity).
Figure 11

Open lands areas encompass a wide range of places, and are included in both the U.S. census and nonmetro definitions. Figure 8 shows that open lands areas take on two forms. In the Midwest, South, and Northeast, open lands areas are concentrated around small towns and metro areas, representing areas that are typically rich in agricultural resources. In the West, open lands encompass plains, plateaus, deserts, and mountain areas. Because open lands areas in the West are so sparsely populated, they often lack access to infrastructure and critical economic and social resources.
Focusing on the open lands areas is particularly important for surfacing data on native populations. Nearly one-quarter of the Native population in the U.S. — which in this calculation includes American Indian and Alaska Native — live in open lands areas (compared to 8% of the total population), and a significant portion of Native lands fall within the open lands category.1 Data about open lands offers a different view into employment growth, per capita income, and poverty rates: They have higher employment growth and higher per capita income than small towns, but a larger share of the population lives in persistent poverty areas.
The differences in who is counted and who is excluded across the rural definitions impacts understandings of critical issues like diversity, equity, and economic opportunity in rural America. Across the rural definitions, it is clear that income inequality is a growing problem, but understanding economic disparities between racial and ethnic groups varies widely depending on the definition that’s used.
Figure 12 shows that significant differences emerge when comparing per capita income across definitions within a single group. Rural Asian Americans living in metro fringe areas have double the per capita income of those living in small towns. Similarly, rural Black Americans have 71% higher per capita income in the metro fringe than in small towns.
Differences across groups also vary when considering different components of the rural definitions. The per capita income among rural white Americans living in metro fringe areas was 53% higher than that of rural Black Americans living in the metro fringe. When we compare across small towns, both groups have low per capita income, but the difference between them is much larger: Per capita income among rural white Americans was 74% higher than the rural Black Americans living in small towns. As a result, differences between per capita income appear larger when using the nonmetro definition than the census definition.
Figure 12

The economic disparities between racial and ethnic groups vary substantially across rural definitions, and thus, the choices we make on which federal definition of rural to use can have a significant effect on shaping our understanding of issues around racial and ethnic diversity and equity.
![]()
Choosing a definition to tell the story
For most readers who use data to understand rural areas or tell stories about them, the question of which definition one should use will likely come down to a choice between the two definitions we have described. If you turn to user-friendly data tools from the U.S. Census Bureau, the Bureau of Economic Analysis, or the Bureau of Labor Statistics to access demographic and economic data, the only options are likely to be the census definition or the nonmetro definition. As the data show, we can tell different stories and draw different conclusions about rural America based on the definition that we choose.
The question is, which should we use?
To answer this, we first have to begin with what makes a good definition. When defining rural America in order to track the outcomes of people who live in rural areas, the goals should be to group places that share characteristics that most impact social and economic outcomes.
When forced to choose these two definitions, we believe that the nonmetro definition best describes places that share common characteristics, better represents the diversity of rural America, and reflects the critical social and economic dynamics of smaller economies that link open land areas and small towns. As the analysis shows, the census definition groups together rural places that differ greatly in demographic and economic characteristics, and is dominated by metro fringe areas that have more in common with suburbs and benefit from the dynamics of large, urban economies.
Yet the nonmetro definition is not perfect, and as noted, was not specifically designed to capture the characteristics of rural areas but to categorize the places that are “not metropolitan.” Users should be aware of its limitations, the most critical being that the nonmetro definition excludes some places that are rural in character but located in metropolitan counties. This is particularly true in the geographically large counties of western states such as California and Arizona. When focusing on these areas, leveraging a rural definition that uses areas at a lower level than a county can be helpful.
It is also important to recognize that rural definitions change over time. There are two types of changes occurring:
- First, the areas classified by the census and nonmetro definitions as rural will be updated using population counts from the 2020 census. In most cases, the areas that are reclassified will shift from rural to “nonrural” due to population growth over the past decade. This administrative process of reclassifying perpetuates a narrative that rural America is in constant decline because the rural areas that are experiencing economic and population growth are regularly reclassified as “nonrural.”
- Second, the statistical agencies that maintain the definitions regularly change the classification system. The U.S. census is changing its systems for classifying rural areas, which is expected to cause some areas previously considered urban to be reclassified as rural. Similarly, changes to nonmetro classification were considered in 2021, although the proposed changes were ultimately dropped. Just as rural America is a constantly evolving place, so are the rural definitions.
When working with data it is critical to understand what point in time is being used to classify rural areas, and to consider how the people and places classified as rural change over time.
It’s also important to know that there are more than two definitions out there. Federal agencies like the U.S. Department of Agriculture (USDA) have developed a unique set of definitions designed to either focus on identifying places with specific rural characteristics, or identifying rural places along a continuum as a way to address the shortcomings of the census or nonmetro definitions. For example, the Frontier and Remote Area Codes developed by USDA aim to provide policy-relevant information about conditions in sparsely-settled, remote areas of the U.S.
Additionally, USDA’s Rural-Urban Commuting Area (RUCA) codes categorize rural areas by population density, urbanization, and daily commuting, offering a more nuanced rural definition by classifying rural places along a continuum that combines aspects of both the U.S. census definition and the nonmetro definition. The RUCA definition in particular is seeing increasing usage as a definition that addresses the shortcoming of both the census or nonmetro definitions, but data for the definition is not readily available, and it requires a higher degree of technical skill when using it in data analysis and storytelling. One way that federal agencies could support better rural data analysis is to make data using these definitions more accessible.
![]()
When rural definitions diverge and money is on the line
Rural definitions not only play a critical role in allowing us to use data to understand and tell stories about rural America, but they are also used to distribute federal resources. In 2017, nearly $773 billion in federal resources were allocated based on geography, and 92 programs used rural definitions to set eligibility requirements for more than $139 billion in funding. Over time, the number of definitions for rural America adopted by federal agencies has proliferated, with many standardized definitions now in use and countless more that are unique to a single federal program. Many of these build on top of the census rural definition and nonmetro definition discussed above, while others adopt entirely unique methods for defining rural America.
The map below (Figure 13) overlays nine common definitions — including the census and nonmetro definitions — used by agencies like the USDA, the Centers for Disease Control and Prevention (CDC), the Centers for Medicare and Medicaid Services (CMS), and the Federal Housing Finance Agency.2 Within this array of definitions, there are places that are rarely defined as rural, places that meet the rural criteria across every definition, and places where the definitions disagree.
Together, the places where there is the most disagreement across rural definitions account for 37.5 million people (Figure 14). These areas have seen almost no population change since 2010, and have a poverty rate of 16%. In other words, the areas that are most disagreed upon across the rural definitions represent places that have fallen behind the rest of the country in terms of population and economic growth compared to places less likely to be classified as rural, and face similar challenges to areas that are more consistently classified as rural.
Figure 13

This system of rural definitions can create challenges and confusion for the rural areas that are caught in the middle — sometimes counted as rural, and sometimes counted as nonrural. Leaders from these places find that there is significant disagreement over whether they are designated as rural, encountering different answers as they navigate from one program or agency to another. The complexity of the rural definitions leads to confusion, frustration, and wasted time for rural leaders who seek to access federal programs and resources.
Figure 14

In an environment in which resources are limited, the act of choosing which definition to use can be the difference in whether an area is able to access critical federal resources or not. The areas caught in the middle find that they are often competing with large urban and metropolitan areas for resources as often as they are with remote areas that are more consistently classified as rural. This dynamic can have dire consequences where critical investments are needed to support thriving communities, but access to resources is more limited due to eligibility requirements related to a patchwork of rural definitions.
Currently, the census definition is the only statistical definition that uses the term “rural,” and it is often viewed as the default or official definition for report statistics on rural America. Yet, other definitions are often used by states, foundations, and federal agencies to set eligibility and distribute funding. This creates confusion.
Establishing an official federal baseline definition for reporting rural statistics, distributing funds, and setting eligibility is one step to reducing confusion. While there will be cases where alternative definitions would be best suited for reporting or setting eligibility or distribution criteria, having an established baseline definition would allow policymakers, researchers, and philanthropists to better evaluate how alternative measures impact who is and is not counted, and explain the rationale for these choices.
There is already an emerging trend that could offer a potential model for a baseline definition. The Federal Housing Finance Agency and the Federal Office of Rural Health Policy have both started defining rural areas as all nonmetro areas and census tracts within metropolitan areas that are classified as rural by the Rural-Urban Commuting Areas (RUCA). This approach reflects the findings above that show that the nonmetro definition better captures common rural characteristics that impact social and economic outcomes, while addressing its shortcoming of excluding areas that share rural characteristics within metropolitan counties.
![]()
Recommendations for researchers, government, philanthropy, and others
The definition we choose to characterize rural America affects our understanding of a wide range of topics — population size and growth, economic development, racial and ethnic diversity, and equity in opportunity and outcomes. It is difficult to build a solid understanding of these issues in rural America without being thoughtful and transparent about how we choose to define it. This places the responsibility on those who use data to be aware of how the definitions we choose shape the story we tell about rural America.
Different types of professionals use rural data in different ways, and we offer a few principles that can be used across fields:
- Researchers and journalists who use data to communicate insights and stories about rural America should be diligent and rational about selecting the definition used for analysis and storytelling. When reporting data on rural America, cite the definition used to generate that data and explain the rationale for why the definition fits the topic. It is also important to scrutinize the research and reporting of others to understand the definition that is used. When selecting a definition, one consideration should be the impact the choice has on comparison with other sources. As we have shown, the census data and the nonmetro definition are not directly comparable because they count different people and places as rural. One should be particularly cautious about developing new rural definitions unless there is a strong justification for doing so.
- Organizations and institutions that invest in rural prosperity — including those within the public, private, and philanthropic sectors — need to understand the implications of the rural definitions they use to inform strategies, target investments, and set eligibility for funding. This begins by understanding how different types of rural places — from small towns to open lands and the metro fringe — experience issues like economic opportunity, health, and poverty. This is particularly critical when tackling issues of racial equity. As the data show, the diversity of rural populations varies based on the definition that one uses. Figure 10 showed that rural Black and Hispanic or Latino populations are more likely to live in small towns, while rural Native American and Alaskan Native populations are more likely to live in open lands areas that include Native areas. If the goal is to improve outcomes for specific racial or ethnic groups in rural communities, it is important to know where those populations are located and make sure they are included in eligibility criteria. If a rural definition is selected without this kind of consideration, organizations and institutions run the risk of excluding the very populations they seek to reach.
- Government agencies should work to simplify the complex web of rural definitions used to allocate resources and set eligibility criteria. The current structure forces many rural communities to navigate a complicated array of requirements, with a large land area and population caught in the middle between conflicting definitions. One step forward would be to establish an official federal definition of rural that could serve as a baseline for evaluating the use of alternative rural definitions. This would allow federal agencies to be deliberate about using alternative definitions, and provide a baseline for reporting on financial implications and communicating any changes in how people or places will be counted. These decisions can have unintended consequences for rural areas in terms of accessing critical federal resources to support rural prosperity, and should be accompanied by greater transparency and analysis.
- Statistical agencies and sources of public data should make it easier to access data across different rural definitions. In the current environment where there is a proliferation of rural definitions, it needs to be easier to access data on these definitions so people can compare them and make informed decisions on which one to use. Today, most public data are only available for the census and nonmetro rural definitions, and sometimes translating data into these definitions is a technical challenge. Promoting more thoughtful comparisons requires including the option to view or export data using a wider array of rural definitions, and publishing data at the census tract level so that rural definitions that define areas at sub-county levels can be constructed and analyzed using source data.
About our partners
MDC: MDC is a nonprofit organization that partners with Southern leaders and communities to catalyze systemic change and allows more people to thrive, and offers research and analysis, community change and advisory services that can help communities create an “infrastructure of opportunity” — the aligned systems and supports that can boost everyone, particularly those who’ve been left behind, to higher rungs on the economic ladder.
Thrive Rural: A small group of Robert Wood Johnson Foundation grantees is working collaboratively towards a future where communities and Native nations across the rural United States are places where each and every person belongs, lives with dignity, and thrives. This work is one piece of that effort. For more information, please visit, ThriveRural.org.
Robert Wood Johnson Foundation:The Robert Wood Johnson Foundation is committed to improving health and health equity in the U.S. In partnership with others, it is working to develop a Culture of Health rooted in equity that provides every individual with a fair and just opportunity to thrive, no matter who they are, where they live, or how much money they have.
![]()
Footnotes
1. The census category “American Indian and Alaska Native” refers to Native peoples living in what is presently known as the U.S.. In this story, we use the term “Native lands” to refer to what the federal government describes as “Indian Country,” a designation which, like “rural,” also has many competing definitions.
2. Rural definitions used in rural disagreement analysis:
- Health Resources and Services Administration
- Centers for Disease Control
- Rural Urban Commuting Area (>=4)
- Rural Urban Continuum Codes (5,7,9 – Not metro adjacent)
- Urban Influence Codes (>=9 – Non-CBSA)
- U.S. Census Bureau
- Nonmetro (CBSA)
- Frontier and Remote Access
- Federal Office of Rural Health Policy
![]()