
Mapping in rural America
As COVID-19 sweeps across the country, rural communities face intense and exacerbated threats. Already-struggling rural hospitals have been stretched beyond capacity. Main Street businesses are being crushed by layoffs. The spectre of the small town devastation that the 2008 recession wrought looms large in the background.
Responding to these imminent challenges will require a precise understanding of what rural communities are facing. But that’s where people often hit a problem: Rural data is often hard to find and use.
At CORI, our mapping and data analytics team is working hard to change that by making rural data more usable and accessible. But the challenge is still real. Rural areas have low population densities and less in-house data analytics capacity. And because much of the country’s focus is on cities, there aren’t many rural data experts. Even defining “rural” can pose a challenge. (Did you know that the federal government defines rural in 15 different ways?)
One of our earliest projects was creating a map that overlaid key growth indicators — like fast internet, higher ed, and Opportunity Zones — to find the rural places across America ready for digital economies. We even used this map to identify communities for the first cohort of our Rural Innovation Initiative.
In December 2019, we took that tool to the next level by launching the Rural Opportunity Map, a powerful suite of mapping and data tools using an unprecedented level of rural data granularity to show that economic promise can be found across America.
Data visualization during a pandemic
COVID-19 has made this data work even more urgent — people everywhere need to know how the pandemic is affecting rural areas. This is why we recently partnered with Newlab and STAT, to build a County Preparedness Score that tracks how ready each county in America is to address an outbreak of the virus.
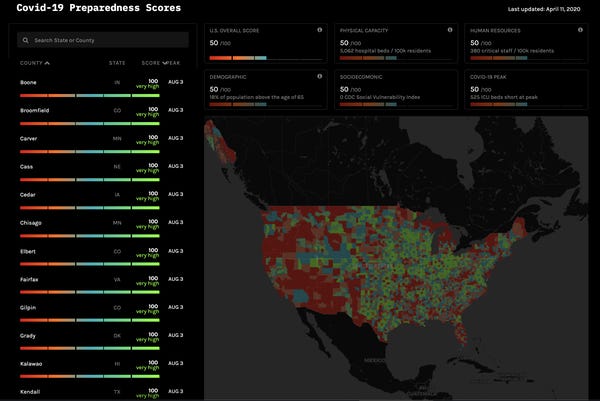
By aggregating key data points like staff capacity, ICU beds, and socio-economic vulnerability, we were able to highlight places in advance that might need emergency resources if an influx hits. This Index leaves no place behind, ensuring that rural towns aren’t left out of the COVID conversation. And the work has already made a difference, with audiences as diverse as Fox News, Business Insider, and health scholars engaging with the work and its implications for rural America.
Throughout the pandemic we’ve also built other maps — often working in partnership with Spatial Data Science company CARTO — to identify the devastating effects the virus could have on rural areas. With schools closed across the country, we identified more than 4.5 million students who live in areas without broadband access, signaling where emergency connectivity is needed most.
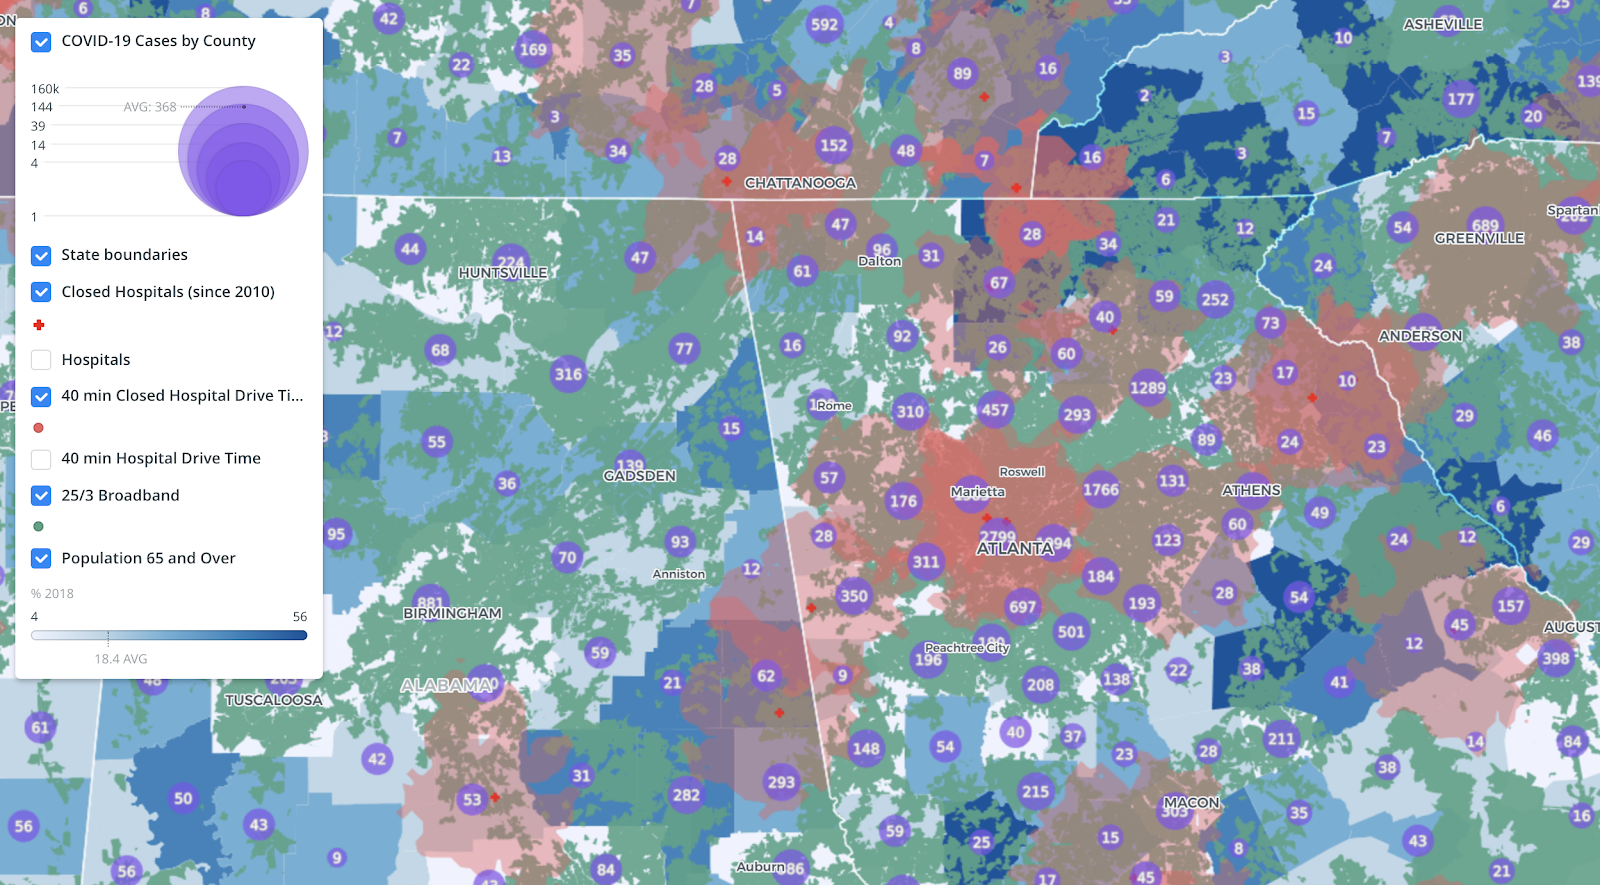
With hospitals facing overflows of patients and patients not wanting to risk disease, telehealth is often touted as a solution. We mapped where the broadband needed for telehealth coincides with health care gaps, pointing to where resources could be deployed.
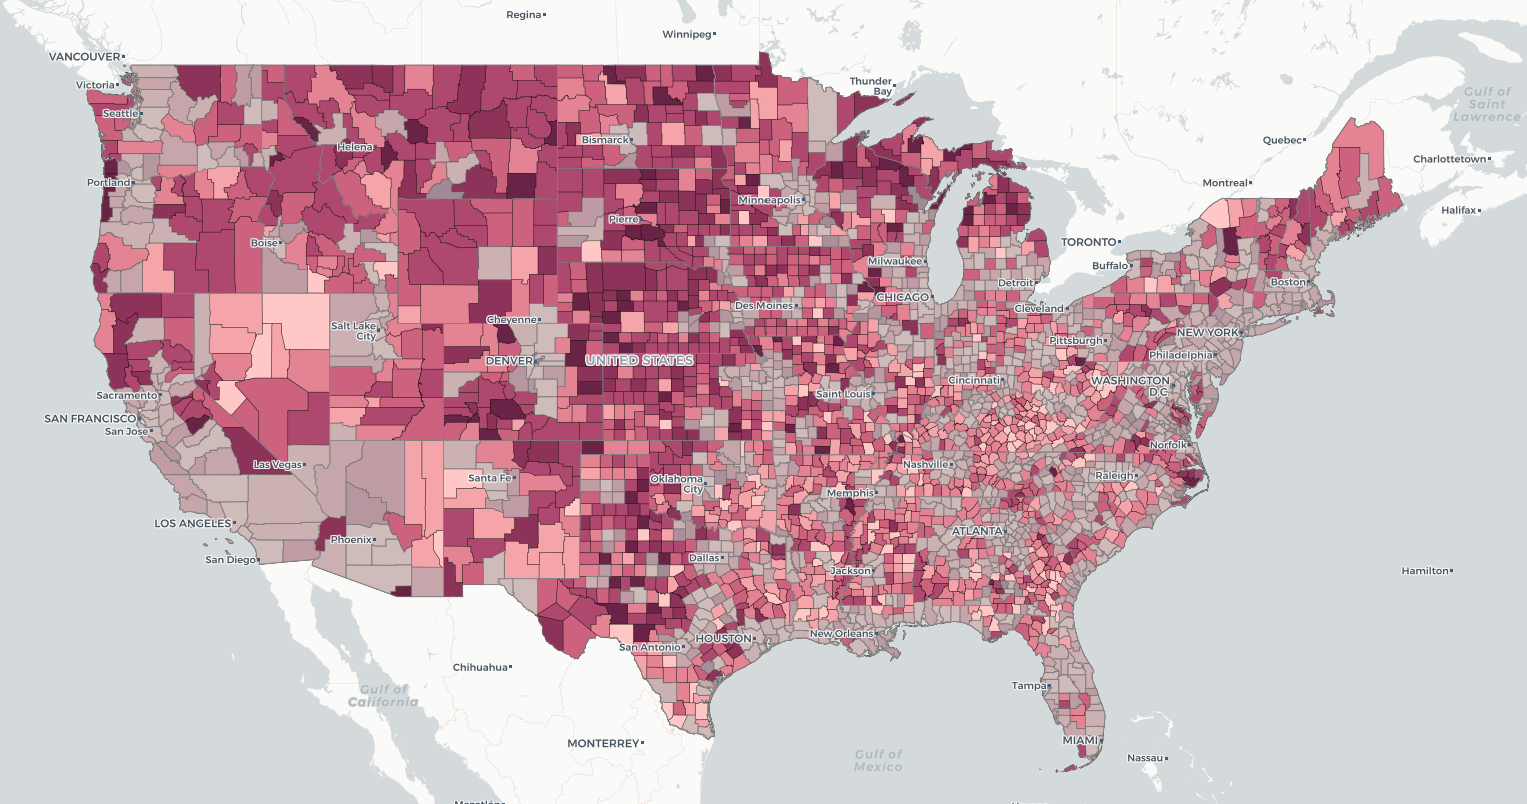
With shelter in place orders shuttering businesses nationwide, we used data to identify what places would face the biggest employment hits. What we found was troubling: Rural America faces a disproportionately high employment risk.

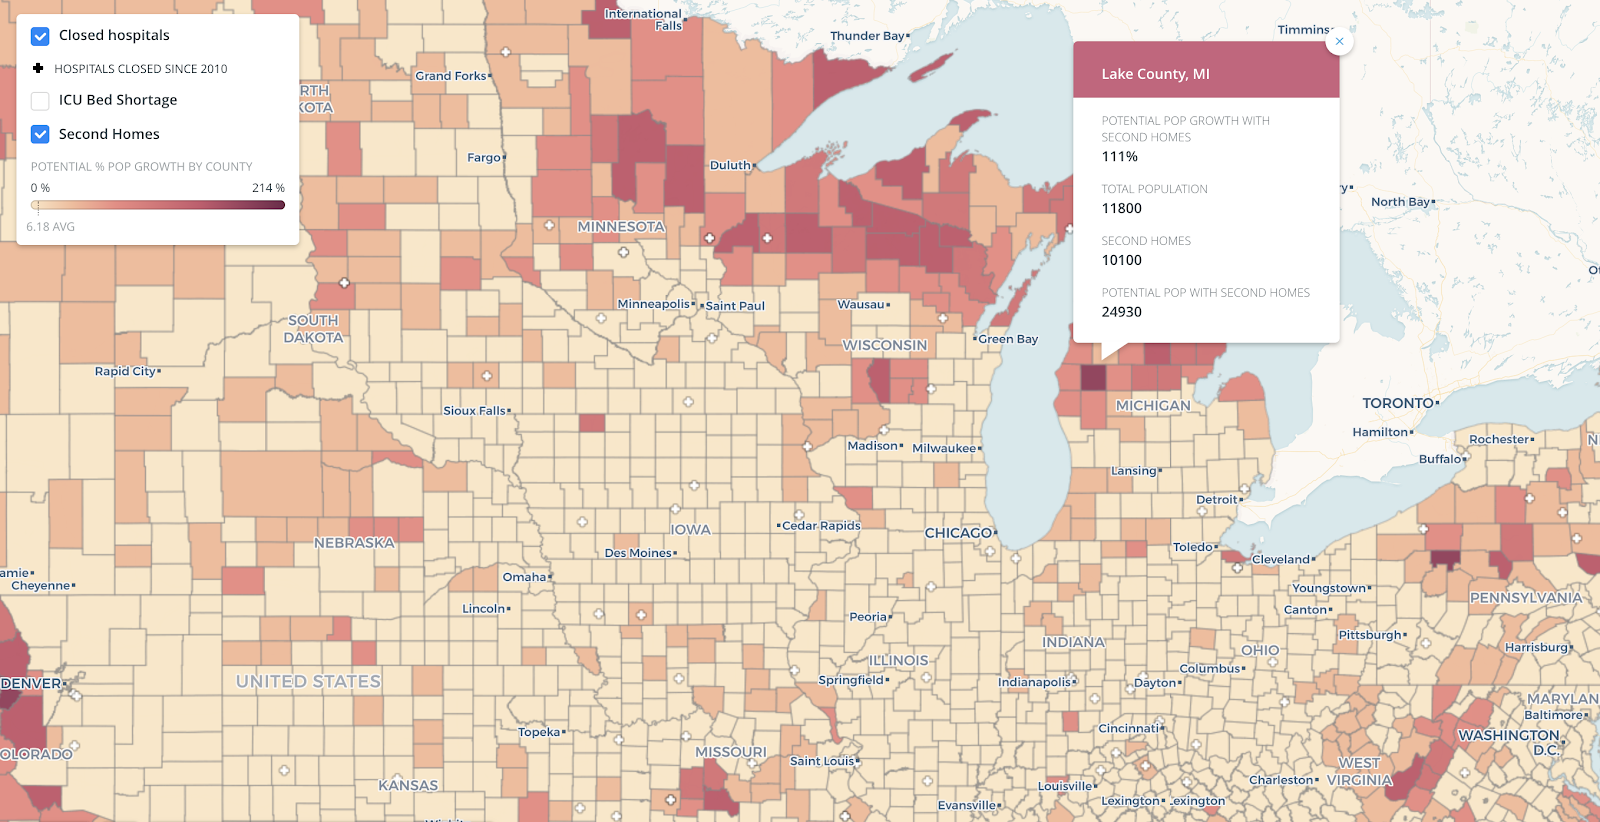
When the number of COVID cases surged in major cities and caused people to flee, we created an Urban Exodus map to illustrate what happens to rural hospitals when urban-dwellers abandon their full-time residences and escape to their rural second homes.
All these maps and tools show important information on their own, the kind of information that can inform the most effective response to the pandemic sweeping the country. Together, they show just how crucial it is for us all to understand rural America.
If you would like to learn more about rural mapping and data visualization, join us for a webinar that CARTO is hosting on May 13th at 1pm. Register today.
Stay connected
To learn more about our mapping and data analytics work, or to request a map you’d like to see, please contact us