CORI’s Employment Impact Update: August 2020
Each month in our Employment Impact Update, we share key findings, trends, detailed maps and analysis based on BLS monthly employment data to help you understand what’s happening to rural economies.

COVID-19 continues to have an unprecedented impact on the national economy. While the vast majority of pandemic-related coverage has focused on dense urban areas, smaller towns across the country have also felt deep health and economic shocks. Each month in our Employment Impact Update, we share key findings, trends, detailed maps and analysis based on BLS monthly employment data to help you understand what’s happening to rural economies.
Below are our key findings from the August data, released on September 30, 2020.
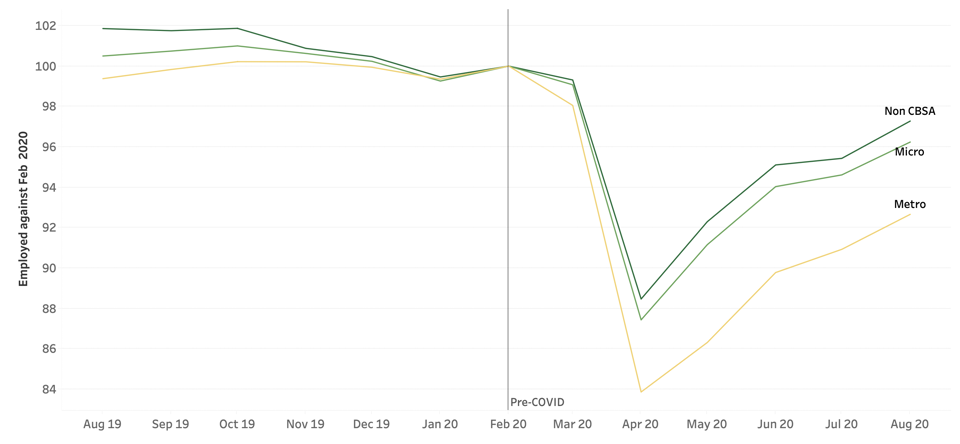
Figure 1. Employment change (%) from February (pre-COVID) to August (current release).
Figure 2: For this month, we also created a dot density map to help understand the actual employment change. Each dot corresponds to the gain (blue) or loss (orange) of 100 jobs.
Topline numbers
Non-metro
- Non-metro areas gained 344,468 jobs from July to August, increasing the non-metro employment 1.8% from the previous month. Overall, non-metro employment is still down 3.4% compared to February 2020.
Metro
- Metro areas gained 2,387,493 million jobs from July to August, increasing the metro employment 1.9% from the previous month. Overall, employment in metro areas is still down 7.3% compared to February 2020.
State and local employment gains
After rural America added only 96,000 new jobs in July, the jobs numbers from August seemed to suggest that the recovery was regaining steam, as rural employment increased by 344,468 jobs. Yet, a closer look at the industries driving growth in August (especially in government, retail, professional services, leisure and hospitality, education, and health) suggests that the recovery may be weaker than the impression that the top-line employment numbers give.
Between July and August, increased government hiring caused an entire quarter of overall growth in payroll employment. This hiring came from two sources. First, the federal government hired temporary Census workers to aid the final push of this fall’s Census count. Second, state and local governments increased hired staff for the start of the school year.
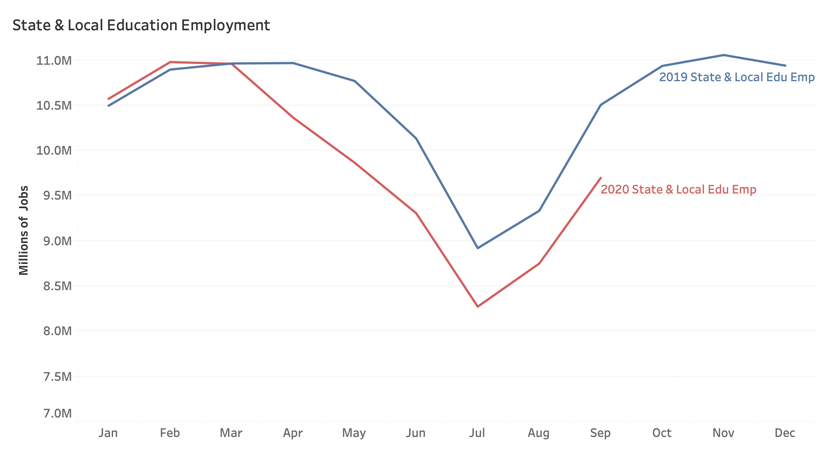
The second increase especially indicates that August’s employment gains do not primarily reflect a thriving overall recovery. Public education employment is highly cyclical. In most years, between late spring and July, employment in the public education sector falls by about 2 million jobs.
Then, as school returns in August and September, those jobs return. Figure 4 shows this dynamic, comparing public education employment in 2019 and 2020. In 2020, employment in public education began to fall earlier, in April, as schools closed to in-person classes, leading to layoffs of school support staff such as bus drivers, custodians, and coaches. This trend continued until July, and then reversed in August, following the 2019 pattern.
This dynamic shows up clearly in this month’s employment map. Many states with counties experiencing employment growth this month are states that start school in early August, including Kentucky, Tennessee, Texas, and Arkansas. We expect similar trends will take place in other regions of the country in the September county employment data, as school openings become more widespread.
A recovery at risk
While August’s increase in employment is certainly good news for individual workers and the economy at large, there is still reason for concern that the rural recovery could be weak or impermanent. By August, public education employment lagged its 2019 levels by more than 500,000 jobs. Preliminary data for September suggests that the 2019/2020 employment gap grew to 800,000.
The month’s top-line gains driven by public employment cover up the fact that there is still weakness in the recovery. Complicating recovery further is the continued slow return of key sectors such as manufacturing, which added just 36,000 jobs in August, but was still down by more than 535,000 jobs since February.
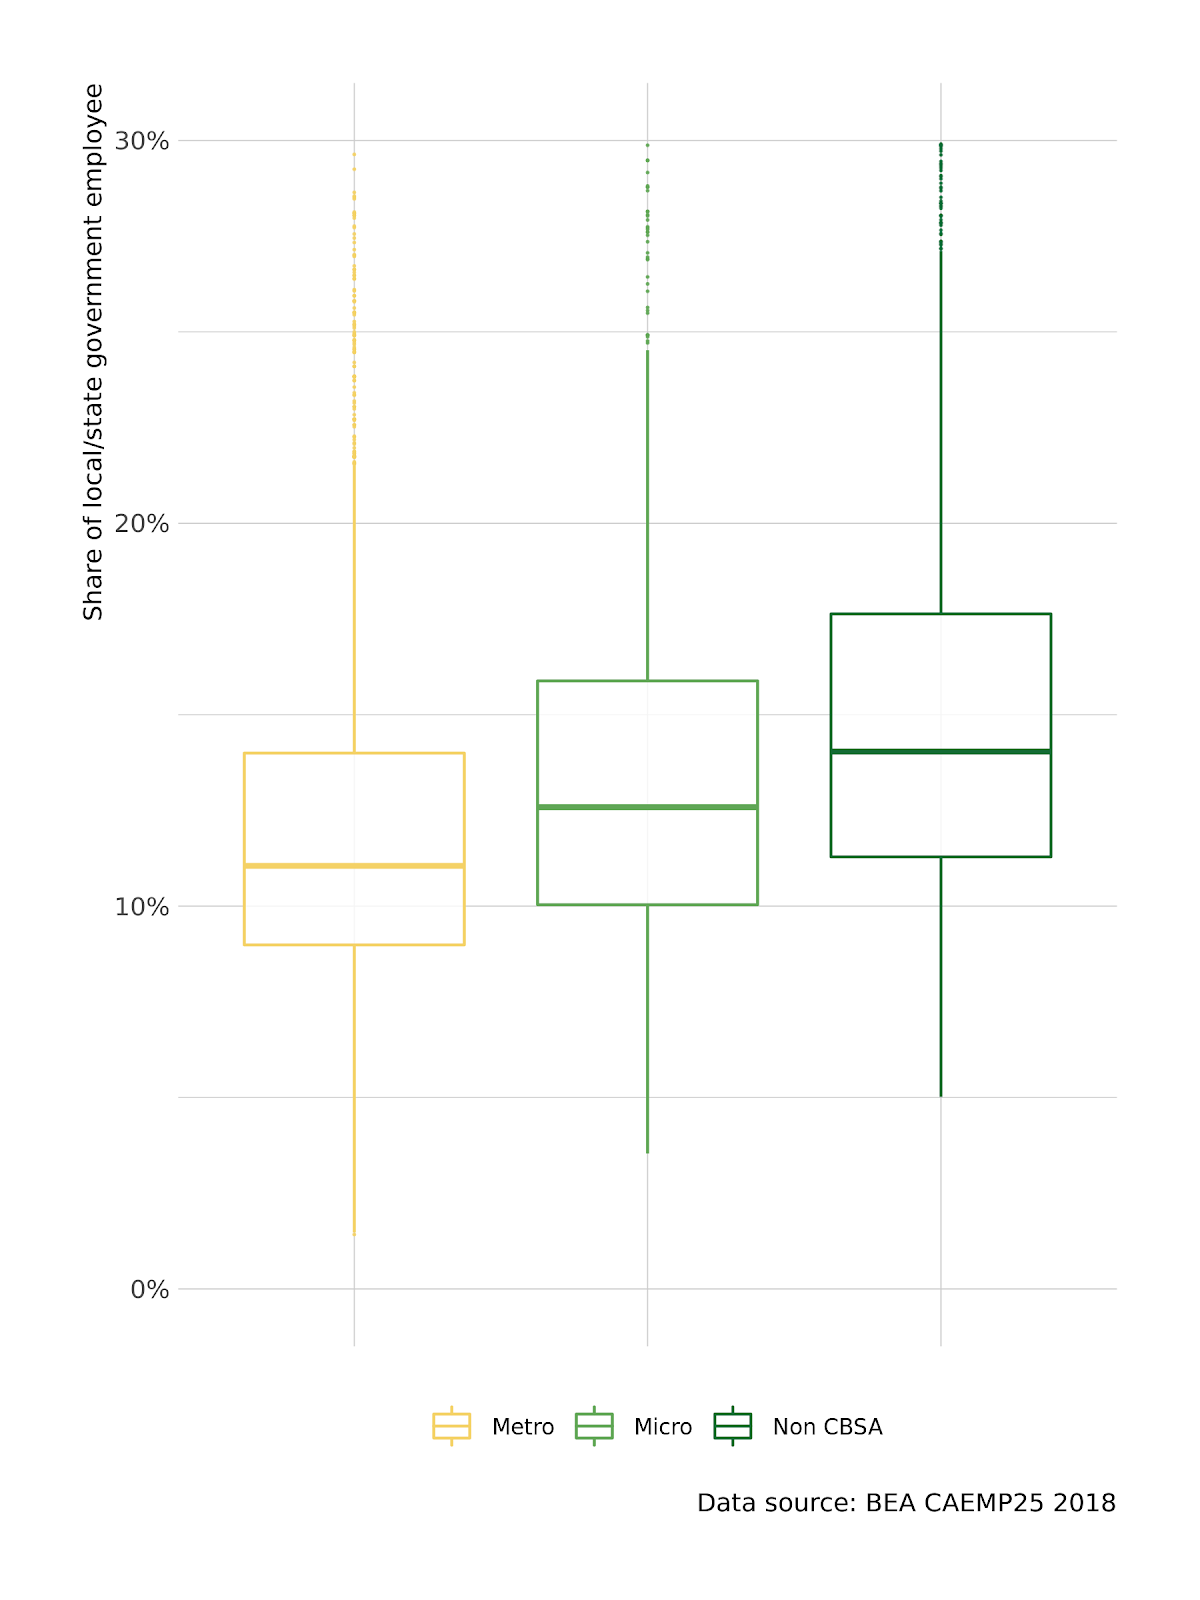
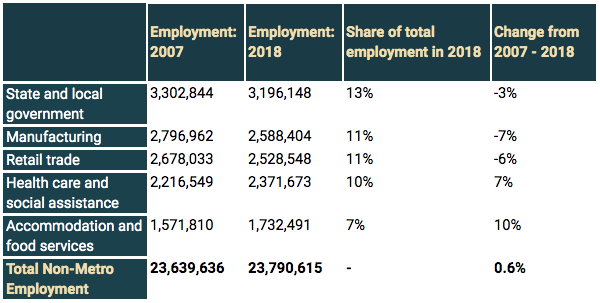
The gap in state and local government employment is particularly concerning for rural areas. In 2018, more people in rural areas were employed by state and local governments than in any other sector, accounting for 13% of total rural employment, compared to 9% of metro employment (Figure 3, Table 1).
Additionally, according to BEA data, there are nearly 300 rural counties where state and local governments account for 20% or more of employment
Rural areas are at increased risk of falling further behind if state and local government employment follows the same trajectory that it did during the Great Recession. The austerity measures taken then resulted in significant cuts to rural government jobs.
By 2018, there were still 3% fewer jobs in the sector than in 2007 — compared to a 3% increase in state and local government employment in metro areas. If the economic fallout from the pandemic persists, we are likely to continue to see declines in state and local government employment as tax revenues decline and rainy day funds run dry.
With this state and local government employment risk, another stimulus package seemingly delayed until after the election, and sustained employment losses in key industries such manufacturing, the recovery in rural America looks fragile. We’ll continue to monitor the trends in state and local government in the coming months, and in the meantime, be alert that not all employment increases mean recovery is on the horizon.
Rural data matters
We’re in the midst of an economic crisis, and we aim to use these monthly datasets, in conjunction with our on-the-ground-knowledge and rural expertise, to help understand and predict what’s next for rural America — and equip leaders and policymakers with the tools to respond effectively. That’s why rural data like this is so important.
This data and our visualizations provide crucial insights into understanding what’s happening in rural America — insights that urban-focused or aggregated data often omit. If you’re a community leader looking to integrate this data to communicate with local stakeholders, see our tips for using data to tell your story.
Stay connected
And if you’re looking to respond to this economic crisis by pivoting to a more resilient digital economy, check out our toolkit for assessing your digital ecosystem, or contact us to learn how we can help.