CORI’s Employment Impact Update: June 2020
Each month in our employment impact update, we will share key findings, trends, detailed maps and analysis based on BLS monthly employment data to help you understand what’s happening in rural America.

COVID-19 continues to have an unprecedented impact on the national economy. While the vast majority of pandemic-related coverage has focused on dense urban areas, smaller towns across the country have also felt deep health and economic shocks. Each month in our employment impact update, we will share key findings, trends, detailed maps and analysis based on BLS monthly employment data to help you understand what’s happening in rural America.
Below are our key findings from the June data, released on Wednesday, July 29, 2020.
An increase in rural employment
Non-metro
- Non-metro areas gained 550,310 jobs from May to June, bringing the non-metro unemployment rate down to 8.8% from 11% in May. Overall, non-metro employment is still down 5% compared to February 2020.
Metro
- Metro areas gained 4.5 million jobs from May to June, bringing the metro unemployment down to 11.6% from 13.3%. Overall, employment in metro areas is still down 10% compared to February 2020.
Figure 1. Employment change (%) from February (pre-COVID) to June (current release).
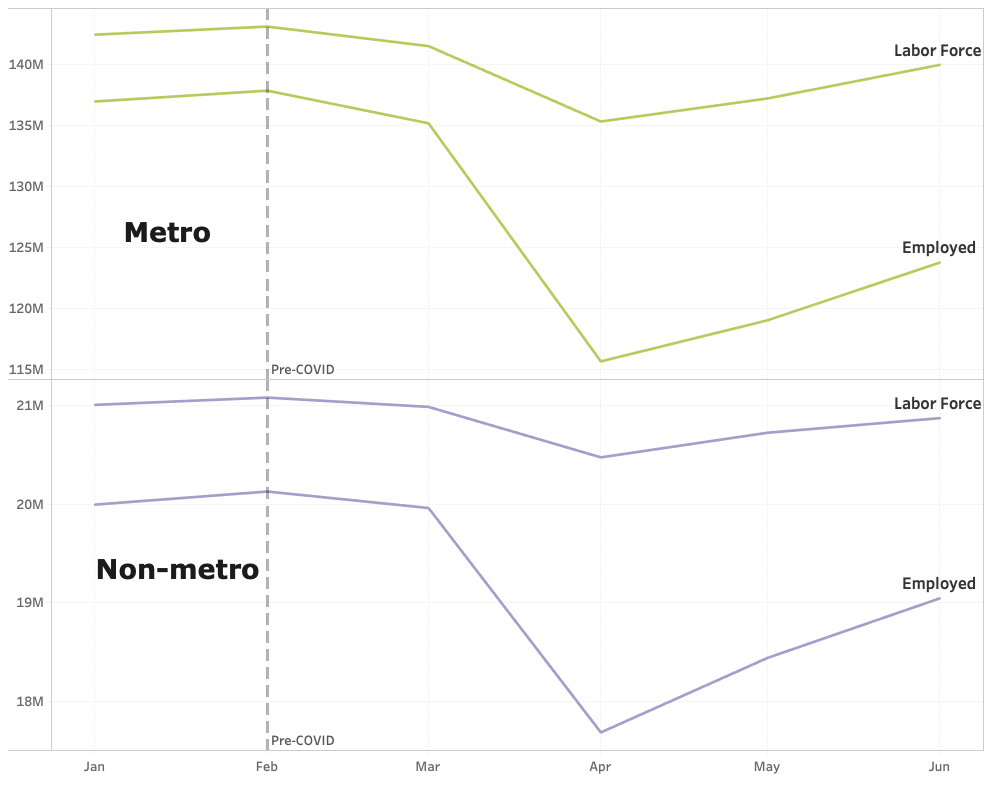
The gap in economic impact on metro and non-metro reflects the unique nature of COVID-19. The relationship between population density, regional economic connections, and the spread of COVID-19 meant that metro areas experienced much larger initial economic shocks.
Since April, metro and non-metro areas have recovered employment at about the same rate.
Yet, it is important to note that aggregating analysis across metro and non-metro areas masks the fact that localized effects can be extreme in both metro and rural places. For example, employment in metro Wayne County, Michigan, increased by 15% from May to June — twice the aggregate metro rate — while employment in non-metro Cumberland County, Tennessee, fell by 5% from May to June.
Varying rates of recovery
Looking beyond national level data to state level data, we find recovery varies greatly across geographies.
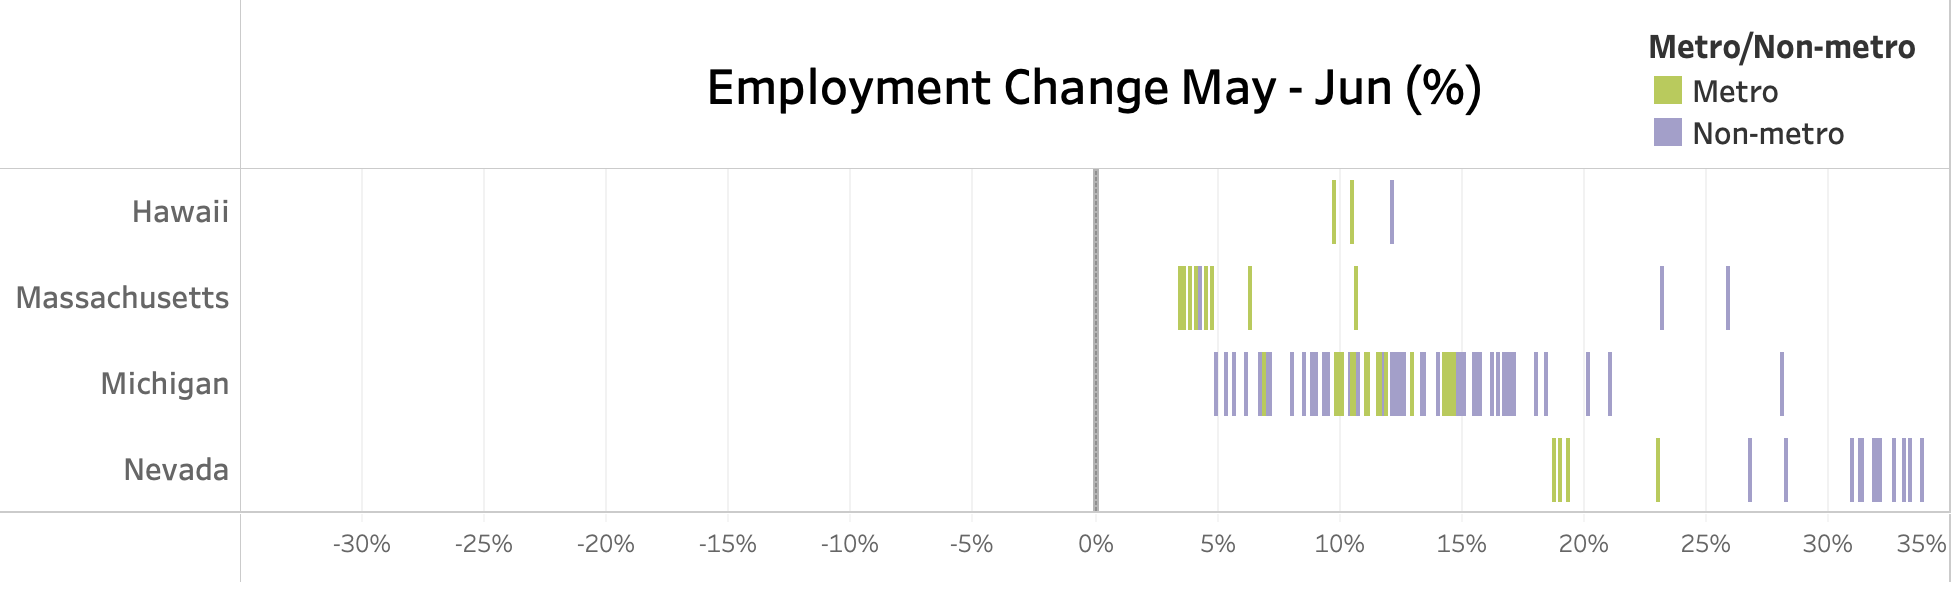
- All Nevada rural counties saw an increase in employment, with a total increase of 31% compared to the previous month.
- The rural counties of Michigan, Massachusetts, and Hawaii saw greater than a 10% increase in employment.
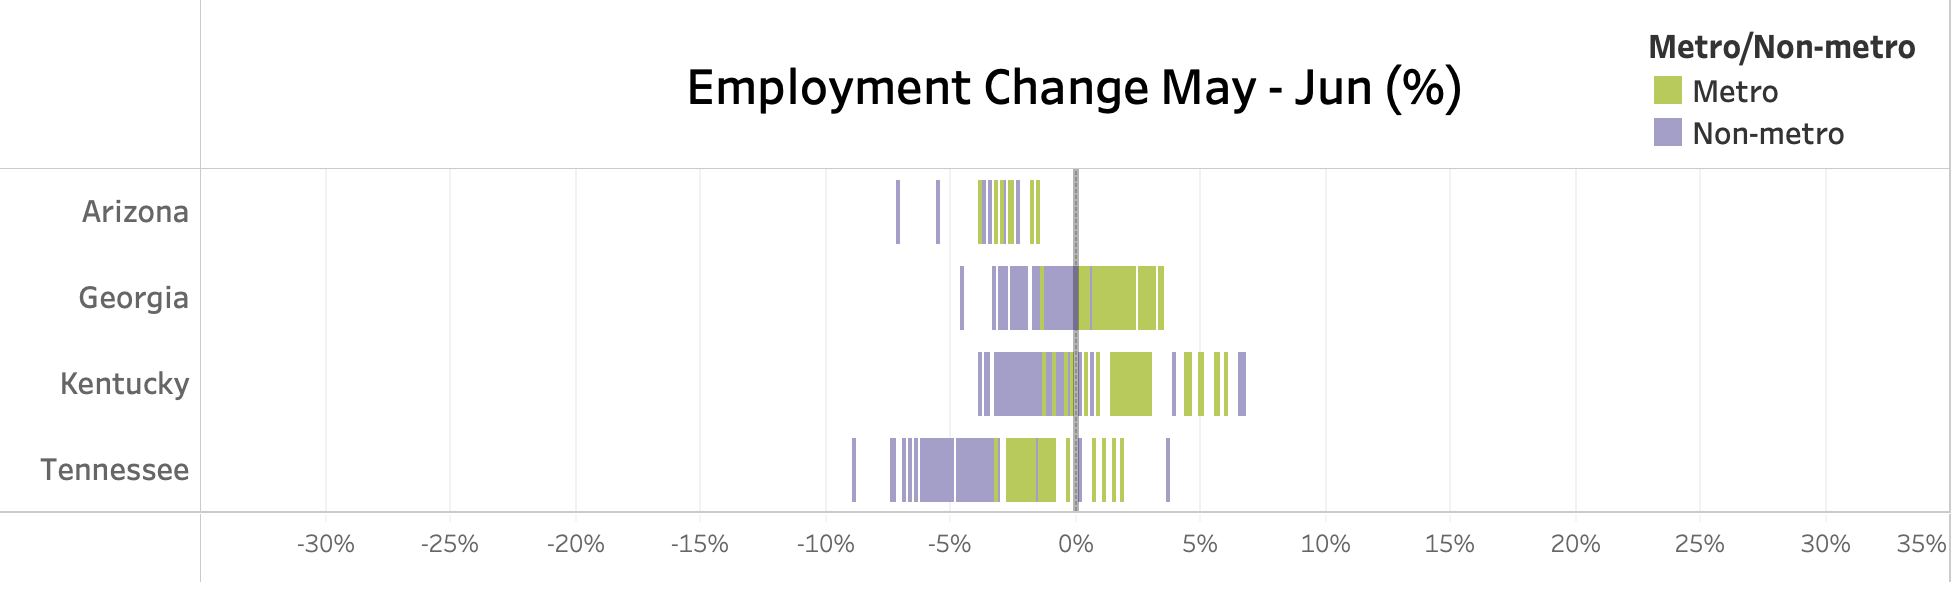
While the economic impact has been less severe in rural areas than metro areas overall, in several states non-metro areas were harder hit than metro areas in June. For example, from May to June:
- Kentucky metro employment increased 4%, while non-metro employment fell 1%
- Georgia metro employment increased 3%, while non-metro employment fell 1%
- Arizona metro employment fell by 3%, while non-metro employment fell by 4%
- Tennessee metro employment fell 2%, while non-metro employment fell by 4%
COVID impacts
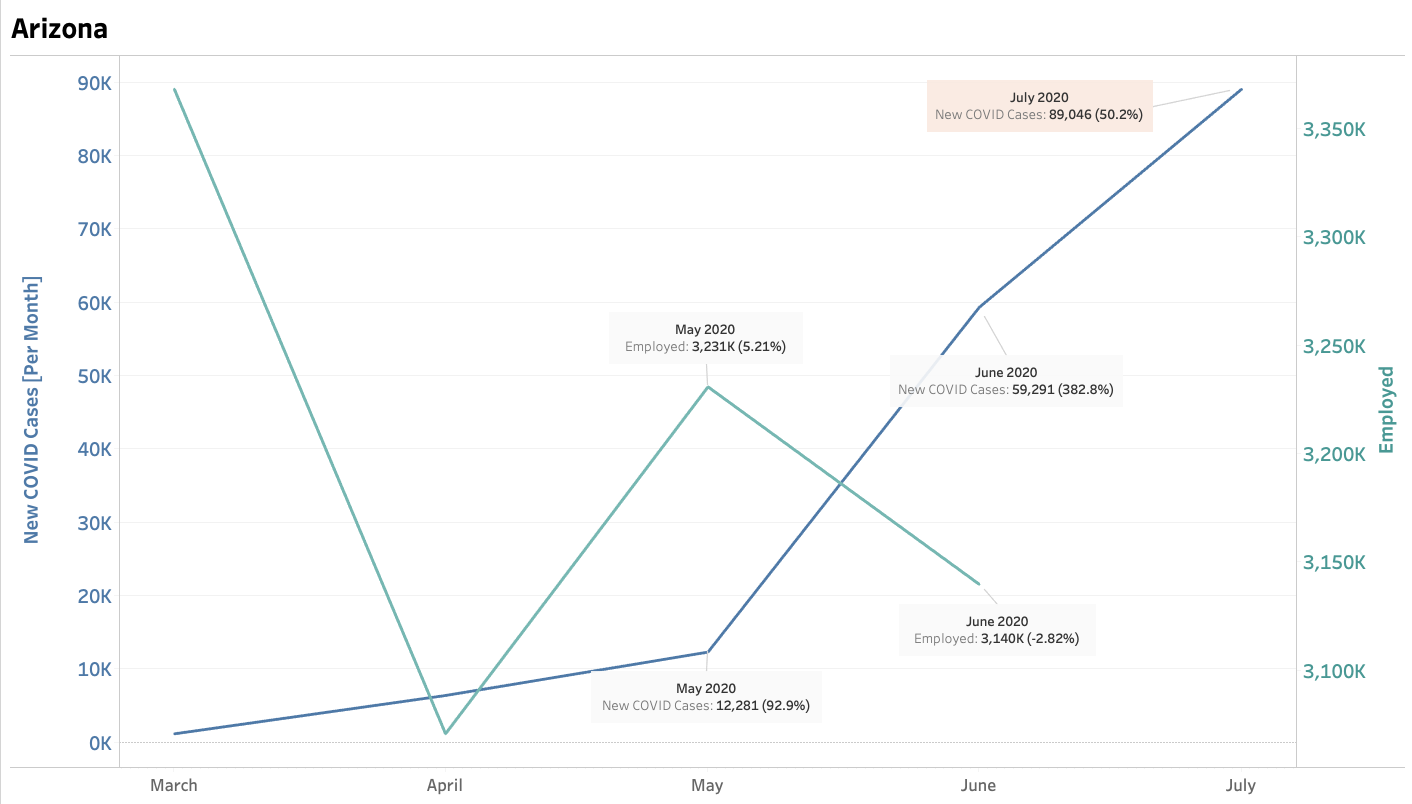
Many of the rural areas in the states seeing a negative economic trend are feeling their second wave of economic pain. They are not experiencing a “V” shaped recovery, but rather the second downward curve of a “W.” For example, in Apache County, Arizona, employment dropped to ~17,000 in April, then climbed to ~17,400 in May, but then dropped again to ~16,400 in June.
The county’s recent economic decline has corresponded with a significant increase in the state’s COVID case count. This pattern has also been evident throughout the entire state of Arizona, where 1,986 more confirmed cases were seen in June than in May, and the statewide employment dropped by 2.8%.
Similar situations occurred in southern states such as Tennessee and Georgia. This story makes sense: Many rural areas lack key resources to address and contain COVID outbreaks, and when loosened restrictions lead to an increase in virus spread, many states have to re-impose restrictions, bringing the economy again to a halt.
Second Homes and Remote Workers
Digging even deeper into the data, we’re noticing the potential emergence of a trend that we will be keeping our eyes on moving forward: In some rural counties, there was a large growth in the labor force from May to June. This trend is common in rural areas with high proportions of second homes.
In March, we predicted that an urban exodus might be on the rise, and tracked where in the country had the highest proportion of second homes, and thus the greatest risk of population spikes and an influx of remote workers.
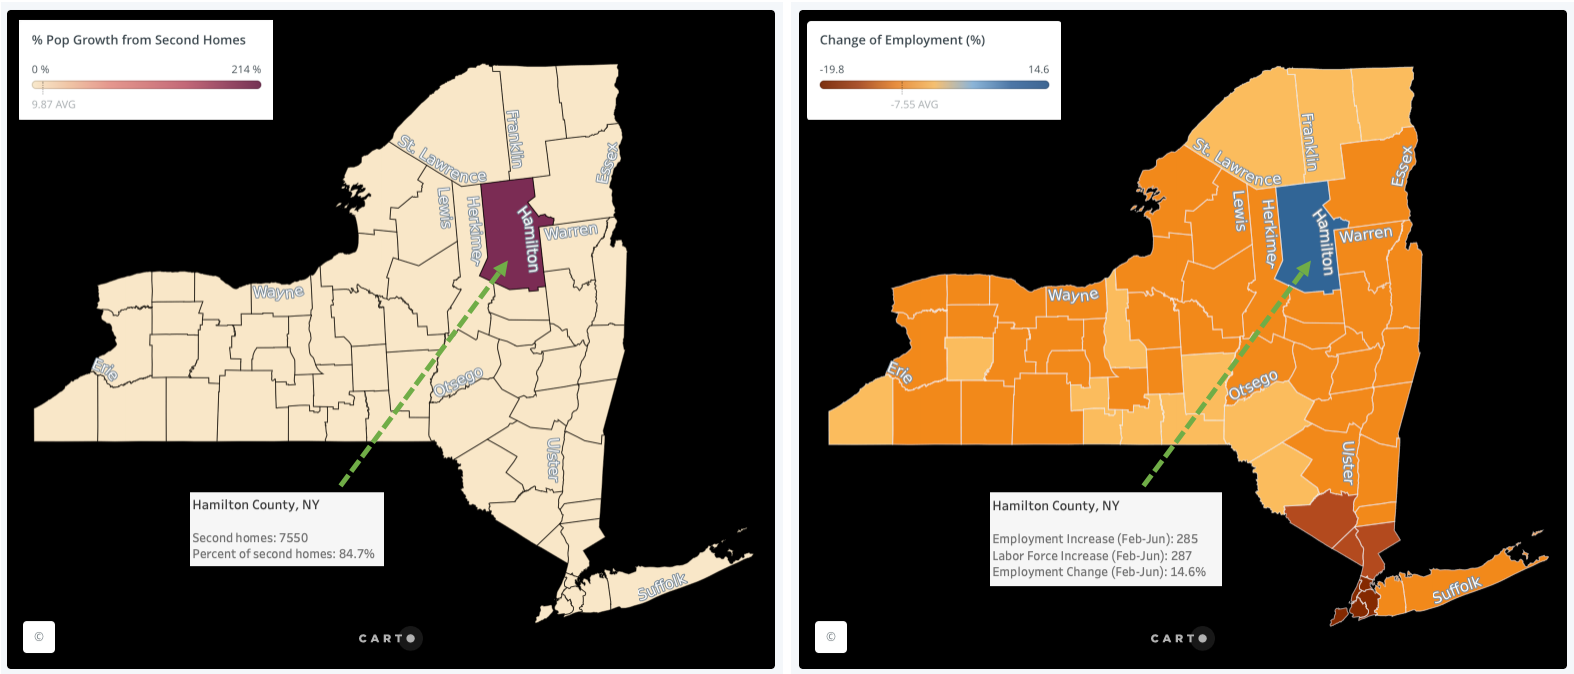
What would an influx of remote workers to second home counties mean for those rural areas? An increase in people arriving can be a problem for hospital capacity, one that needs to proactively be addressed.
However, an influx of people can also bring positive economic ramifications by increasing the local labor force, which is especially impactful when the people arriving bring incomes from jobs they do remotely. These four selected counties with high proportions of second homes demonstrate the promise and challenge of a population influx:
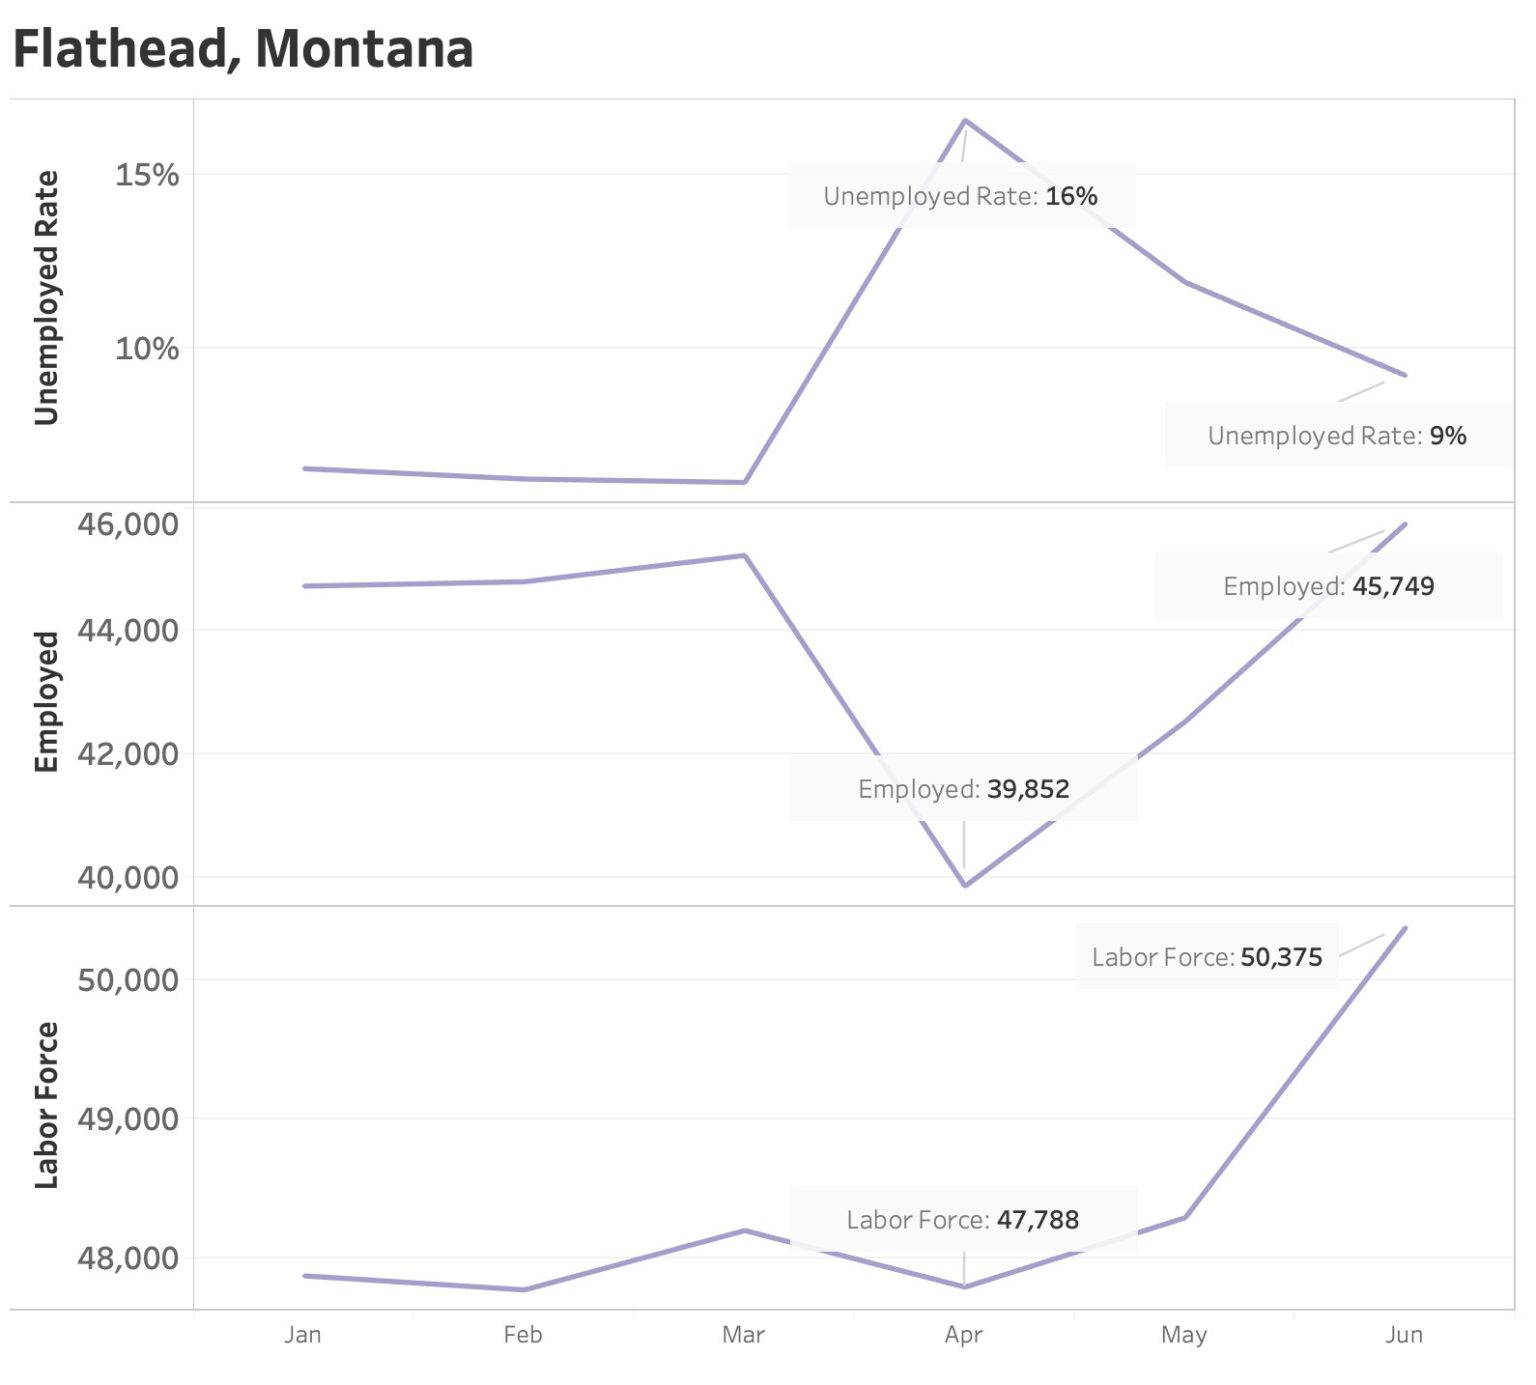
- In Flathead County, Montana, the labor force jumped by 4.3% from May to June, and the number of people employed increased by 7.6%.
- In Valley County, Idaho, the labor force spiked by 8.9% from May to June, and the number of people employed increased by 18%.
- In Hamilton County, New York, the labor force jumped by 3.8%, and the number of people employed rose by 5%. It is the only county in New York to show higher employment in June than in February.
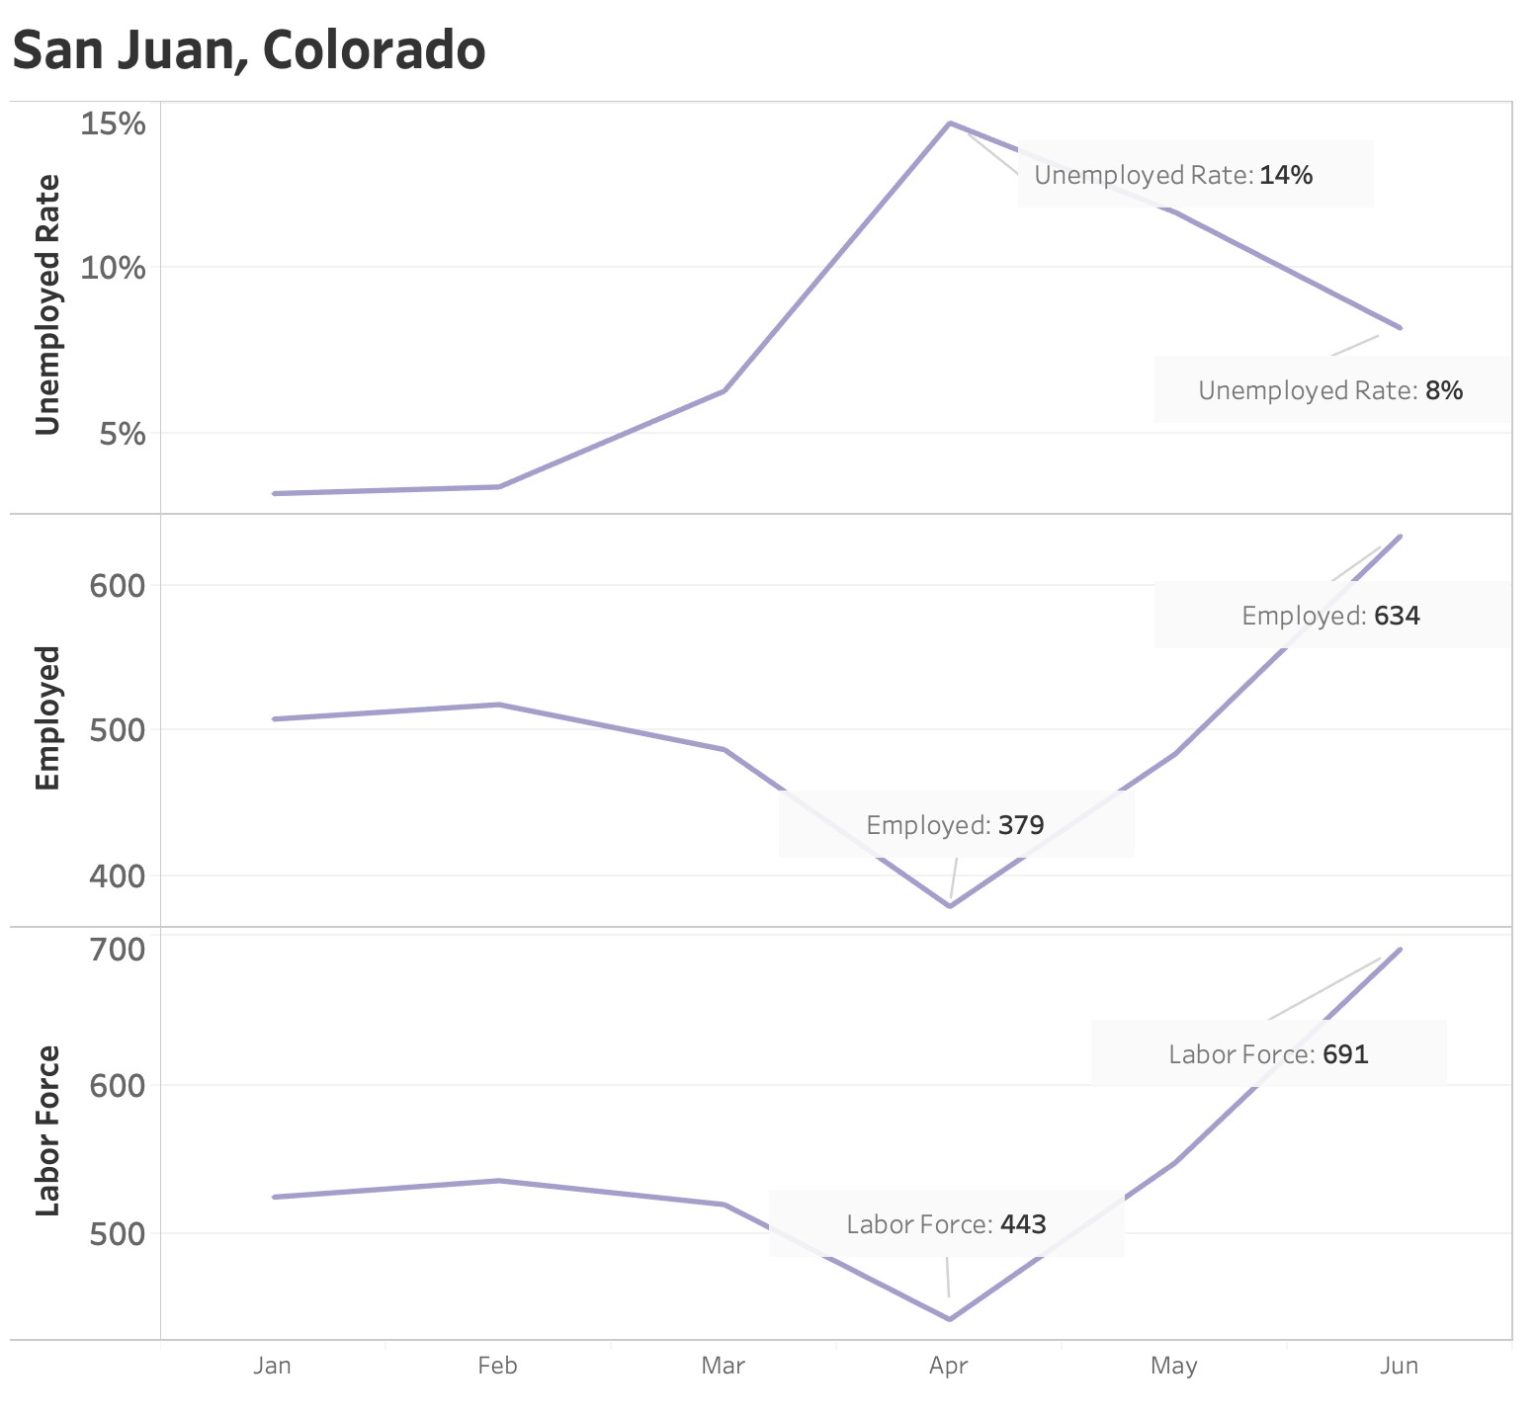
- In San Juan County, Colorado, the labor force grew by 26.1% from May to June, and the number of people employed grew from 30%.
In all of these places, there is a high percentage of second homes, places where urban refugees can flee to the safety of space. In San Juan County, for example, according to the Census, there are over 350 second homes with a total population of about 600. Given there were nearly 700 people in the San Juan County labor force in June, a large number of workers could be people living and working from their second home.
It’s important to note that this influx of new workers is not a silver bullet for local economies, and doesn’t come without consequence.
In many counties, such as Flathead County an increase in the local labor force has not led to a proportional reduction in the unemployment rate: Total employment is higher than the county’s March peak, but the unemployment rate remains higher than its March low.
This suggests a possible pattern: While new residents are bringing new jobs, many existing residents who had lost jobs have yet to recover them. This is why ecosystem development is so crucial for inclusive growth.
We aim to use these monthly datasets, in conjunction with our on-the-ground knowledge plus deep rural expertise, to help us understand and predict what’s coming next for rural America. As this economic crisis continues, we’ll continue sharing emerging trends and analysis to illustrate the realities of what’s happening in small towns across the country.
Rural data matters
We’re in the midst of an economic crisis, and the only way leaders and policymakers can respond effectively is by understanding its true impacts. That’s why rural data like this is so important. This data and our visualizations provide crucial insights into understanding what’s happening in rural America — insights that urban-focused or aggregated data often omit.
If you’re a community leader looking to integrate this data to communicate with local stakeholders, see our tips for using data to tell your story.
Stay connected
And if you’re looking to respond to this economic crisis by pivoting to a more resilient digital economy, check out our toolkit for assessing your digital ecosystem, or contact us to learn how we can help.